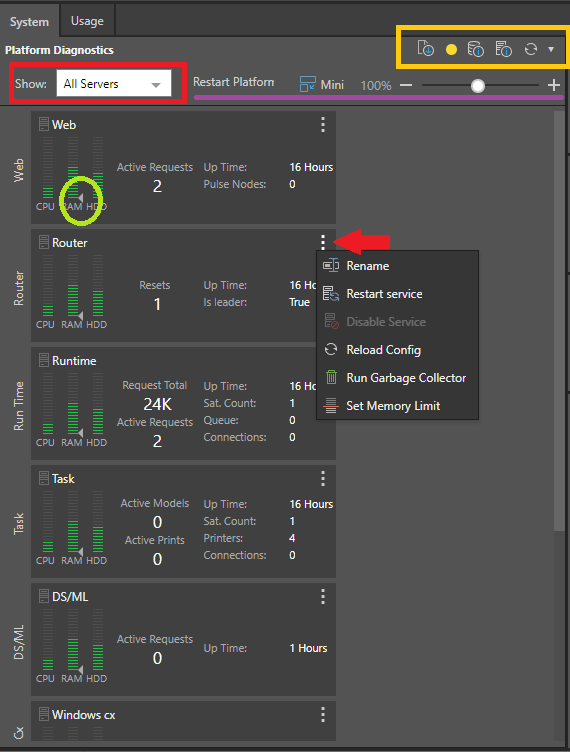
The Diagnostics dashboard interface presents all the system's servers and their usage.
Quick Buttons
The quick buttons on the dashboard (yellow box above) offer access to the following functions, from right to left:
- Refresh dashboard: Refresh the dashboard with the latest diagnostics data.
Note: Use the Refresh drop-down list to select the required refresh schedule. By default, the schedule is Every 30 Seconds. If you don't want to run a scheduled refresh, select None.
- System Info: Opens a dialog that summarizes the entire Pyramid cluster details using JSON. You can copy this information to your clipboard and add it to Pyramid help desk support tickets easily.
- Database Repo: Opens a dialog showing key information about the database repository used for the Pyramid instance.
- Warning lights: These "traffic lights" only appear under certain circumstances, lighting up if you have certain settings that can degrade system performance. Hover over the lights to see more information as a tooltip:
- Red: Settings that have a major impact on performance are currently enabled and should be turned off.
- Amber: Settings are currently enabled that are recommended to be turned off.
- Amber: A new version is released. All users are notified about a major release. Admin users are also notified when there is a minor release. The linked icon takes you to the release notes.
- Amber "T": The task engine has been paused and no new tasks will be processed.
- Download requests dump: Click to download a text file containing details of any currently active requests.
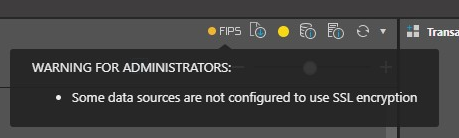
- FIPS Warning light: (Not shown) A FIPS traffic light is shown if FIPS encryption is enabled for Pyramid. For more information, see FIPS Encryption.
Platform Options (All Services)
At the top of the Diagnostics page are a number of options that apply to the full services view.
- Select servers to show: This drop-down list (red box) lets you simplify your view by selecting to see tiles for a subset of your servers. This widget is a multi-select drop-down list, letting you select one, some, or all servers.
The platform options (purple underline) allow you to apply changes to all services:
- Restart Platform: Recycle the whole cluster. For more information, see Restarting Platform, Service Types, and Service Instances.
- Mini Show the simplified version of the tiles for each of the selected services. The mini tiles take up less space on the canvas, showing only the name, resource usage graphs, main indicator, and per-node context menu for the service.
- Zoom (+ slider -): Use the Zoom Slider to either get a more close-up view of your canvas or to see more on the canvas at a reduced size.
FIPS Encryption
Where FIPS encryption is enabled for Pyramid, you will see a "health indicator" traffic light as a Quick Button at the top-right of the dashboard. The traffic light appears as follows:
- Hover over the indicator to see more information about any issue as a tooltip:
- Red: All possible issues are currently reported.
- Amber: At least one issue is reported. This could mean that you have one or more unsecured data sources, or one or more unsecured Active Directory domains.
- Green: There are no issues.
Server Tiles
The server tiles allow you to view a summarized diagnostic report per service.
Name / Service Type Context Menu
Click or right-click the name (blue arrow) to open the Service Type context menu. Any changes made using this context menu apply to all nodes of the selected type:
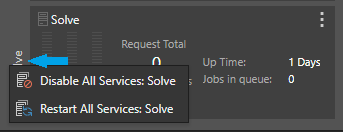
- Disable All Services: <NODE>: Disables all services of the type <NODE>. The Minimum Viable Product (MVP) requires at least one web service instance, one router service instance (the "leader"), and one runtime service instance to continue running. If "disable all" would violate this MVP, then the disable action will only disable those nodes that are not required to meet the MVP. For the router service, the leader will not be disabled. For the web or runtime service, one service is not disabled at random. For more information, see Disabling Service Types or Service Instances.
- Restart All Services: <NODE>: Recycle all services of the type <NODE>. For more information, see Restarting Platform, Service Types, and Service Instances.
Resource Usage Graphs
Each server tile displays the resource usage for the host machine, measured from 0% - 100%, and colored to flag any approaching usage limits:
|
|
Healthy (Default Color) |
Approaching Limit (Amber) |
Limit Exceeded (Red) |
|---|---|---|---|
|
CPU Usage |
85% or less |
86% - 90% |
91% or above |
|
Memory Usage (RAM) |
85% or less |
86% - 90% |
91% or above |
|
Hard Disk Drive Usage (HDD) |
60% or less |
61% - 80% |
81% or above |
- A column indicating usage at healthy levels is colored Green on this type of graph.
- The Memory Usage (RAM) column shows a small indicator on the full-sized tile (green) indicating the current service's current memory as a percentage of the amount of available memory.
System Resource Warnings
The system can send emails and SMS messages to enterprise admins automatically when resource levels usage is determined to be critically high (red). This option can be enabled under networking and requires email or phone messaging to be enabled.
Indicators
Depending on the service type, high-level indicators are provided:
- Active Models: the number of data models currently being processed or scheduled to be processed.
- Active Prints: the number of print jobs currently being processed or scheduled to be processed.
- Active Requests: the number of currently active requests.
- Connections: the number of active connections against the repository database.
- Is leader: a Boolean indicating whether this router is a leader or follower.
- Printers: the number of printers currently connected to the task engine server.
- Pulse Nodes: the number of pulse nodes.
- Queue: the number of requests that are waiting to be processed.
- Request Total: the total number of requests that have been sent to the Run Time server during the current up time.
- Resets: the number of times the server has been reset.
- Sat. Count: the number of satellite servers running.
- Up Time: the time since the server was last reset.
Service Instance Context Menu
Click a server tile's right-hand context menu (red arrow) to access actions that can be applied to each node individually:
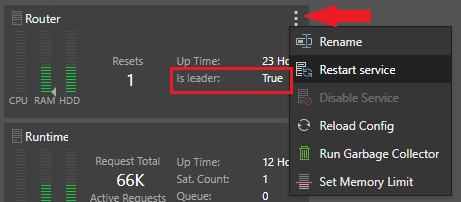
- Rename: Change the description at the top of the panel.
- Restart service: Recycle the service on the host machine. For more information, see Restarting Platform, Service Types, and Service Instances.
- Disable Service: Disable the service instance. The Minimum Viable Product (MVP) requires at least one web service instance, one router service instance (the "leader"), and one runtime service instance to continue running. If "disable" would violate this MVP, then this option is grayed out and cannot be selected (note the red box and disabled menu option in the preceding example). For more information, see Disabling Service Types or Service Instances.
- Reload Config: Instruct the service to reload its stored configuration from the database to flush / refresh its settings.
- Run Garbage Collector: Free up memory by removing unused items. When run from the context menu, the garbage collector cleans up items from the selected service. It can also be run for all services from Server Instances page.
- Set Memory Limit: Provide a dialog that allows administrators to change the upper memory limit (measured in megabytes, MB) for the selected service. For more information, see Service Memory Limits.
Warning: Restarting or Reloading config may render the cluster temporarily inoperable. This will last until the service is restored.