Use the Lineage tool to open a visualization representing how the selected item has been used, and what its related content is. The lineage framework provides users with a holistic view of their content, queries, data models and business logic in a single point and click interface. The lineage interface also includes the ability to view structural metadata, content usage, versioning and role security.
Note: Lineage is not available in the Pyramid Community
Data Catalog Display
The lineage function is one of the primary techniques for seeing the structural connection between analytic objects and data sources - in effect its a way to see the data catalog structure. The data catalog can be viewed in different ways from Discover as well - however, the lineage takes the traditional concept of a data catalog (which provides metadata on the data model) and brings in the analytic content layers into the picture as well.
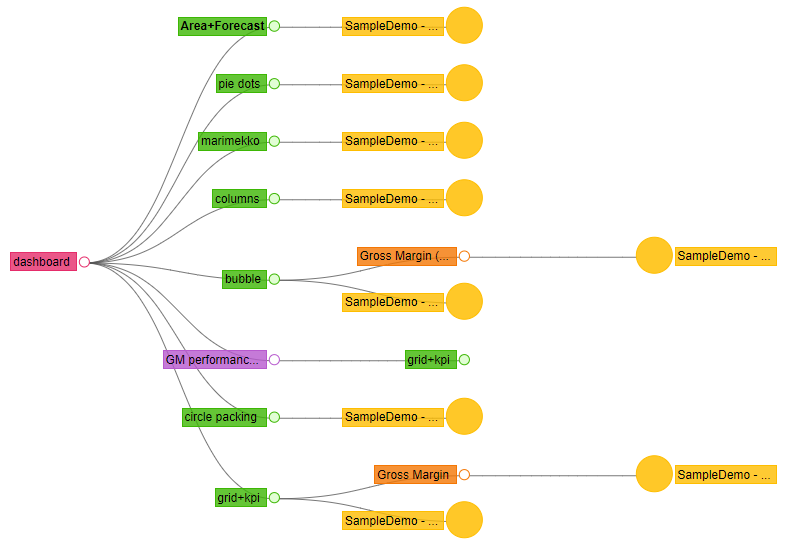
Using the example below, the catalog capabilities exposed by lineage, allow the user to understand how the dashboard (red) is connected to Discover content (green), Illustrate content (purple), Formulate content (orange) and then to data models (yellow content). This is known as related content in Pyramid.
Accessing Lineage
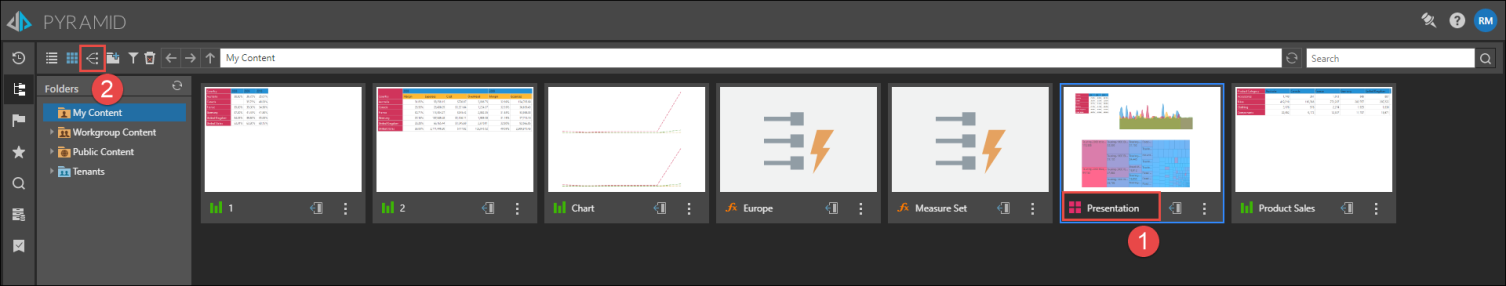
To access this feature, click on the item in any of the different views of the content manager. The Lineage icon will be enabled. Click the icon to see the item's related content in the chart.
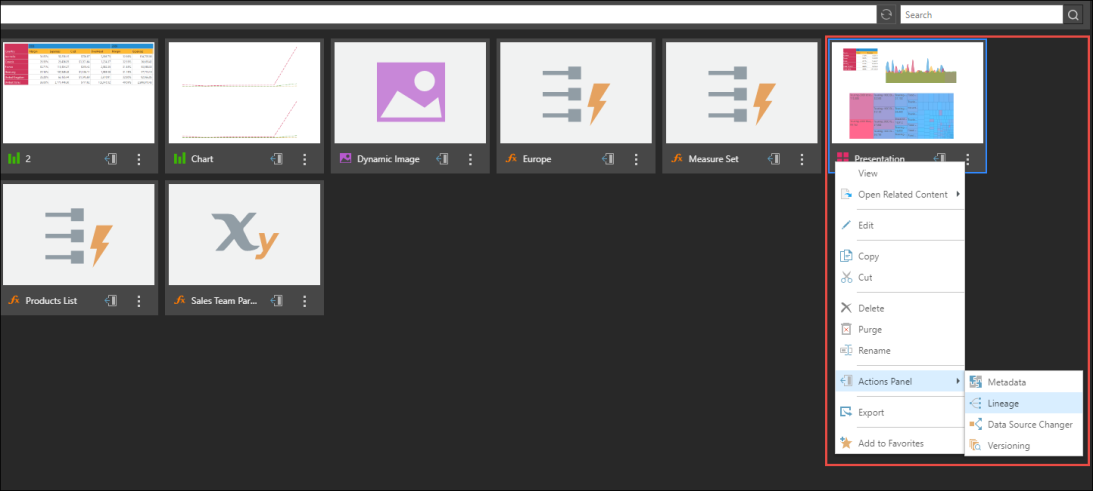
Alternatively, right-click the item's context menu, and click Actions > Lineage.
Once triggered, the lineage tree diagram will be shown instead of the traditional item listing. The diagram and associated metadata panel exposes several nuances details and capabilities.
Export Option
The lineage diagram includes an option to export as a JSON file. Simply click the export icon on the diagram:

The file is downloaded.
Depending on the browser used, an indication might be displayed when the file is downloaded.
Navigating the Lineage Dependency Tree
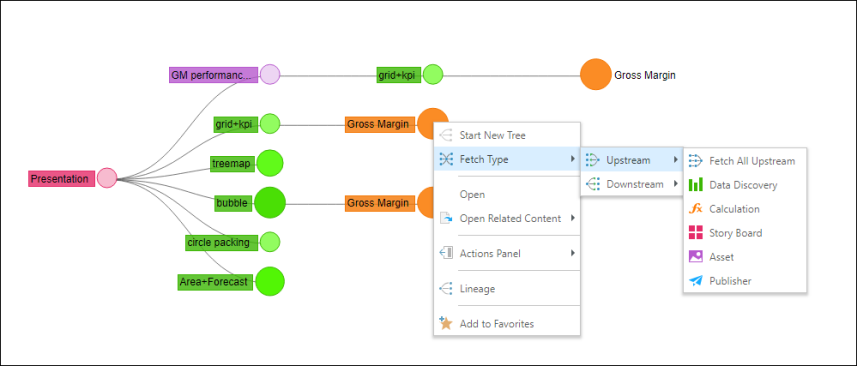
Clicking the primary node will expand the tree to show dependent object at the next level only. The next default dependent object changes depending on the node type. To choose a specific dependency path, right click on the node and choose a specific dependent type from the context menu.
In the example below, the visual shows the items that were used to build the selected presentation. The size of an item's node indicates how many times it has been opened. Hover over the bubble to see the number of usages.
Node Types
Nodes in the lineage tree are color coded according to the app to which the item belongs. The available lineage nodes are:
- Discover - green: queries and visualizations built in Discover
- Formulate - orange: business logic configured and designed in Formulate
- Present - red: presentation dashboards built in Present
- Illustrate - purple: dynamic text and infographics created in Illustrate
- Publish - blue: publication templates built in Publish
- Model - yellow: data flows and models build in Model
Node Actions
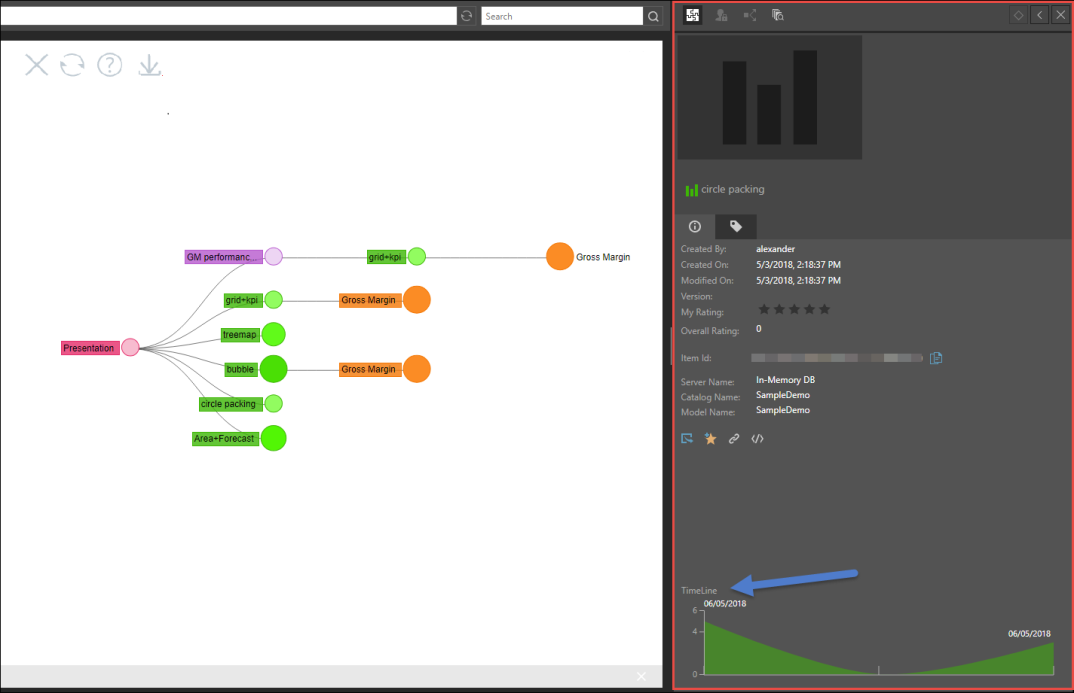
Clicking on a node will show that items dependencies. It will also launch the node's metadata window in the Actions Panel (indicated in red), where you can view usage timeline (indicated by blue arrow) in addition to other Actions Panel functions.
Context Menu
Start New Tree: open a new chart showing the lineage of the selected item and its related content.
- Upstream: see the content that was built using the selected item. For instance, click Upstream to see all the presentations that contain a specified data discovery.
- Downstream: see the content that was used to build the selected item. For example, click Downstream to see all of the data discoveries that were added to a specified presentation.