When a hierarchy or measure is added to the Color or Shape drop zone, a corresponding legend is automatically added to the canvas. Not only can you change the formatting of these legends, but you can also edit the formatting for the legend's individual elements or values (this is called series editing).
There are two different types of legend:
- Discrete legends: Display a discrete list of elements in the given hierarchy, or a list of measures.
- Continuous legends: Display a range of values for the given measure.
Discrete Legend
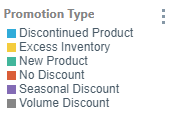
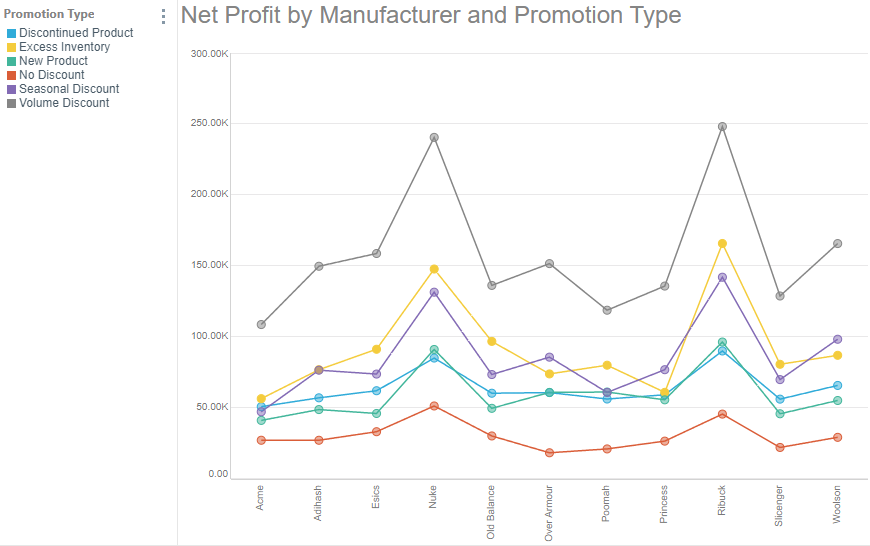
A discrete legend is made up of a list of elements or measures, which are color-coded according to the color assigned to them in the visualization. Whenever a hierarchy or list of elements is added to the color or shape zone, a discrete legend is produced.
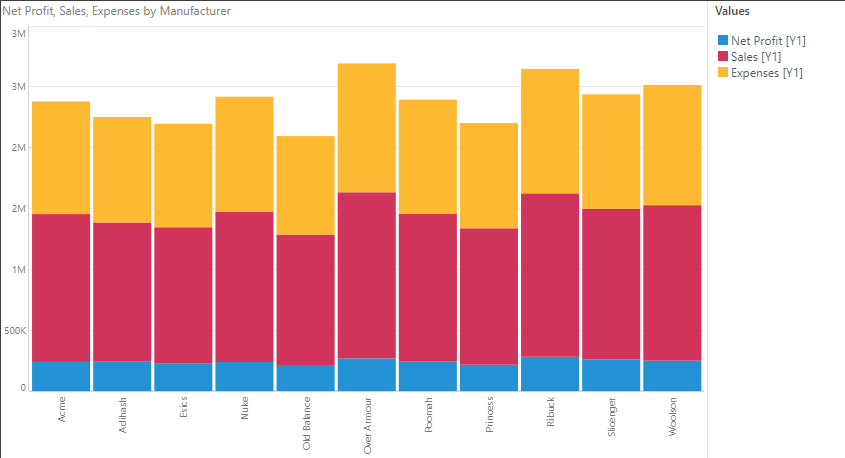
This kind of legend is also produced when building multi-measure charts, like combo charts, stacked measure charts, and multi-measure pie or doughnut charts; in this scenario, each item in the discrete legend corresponds to a measure in the visual.
Each item in the discrete legend corresponds to an element or measure in the visual.
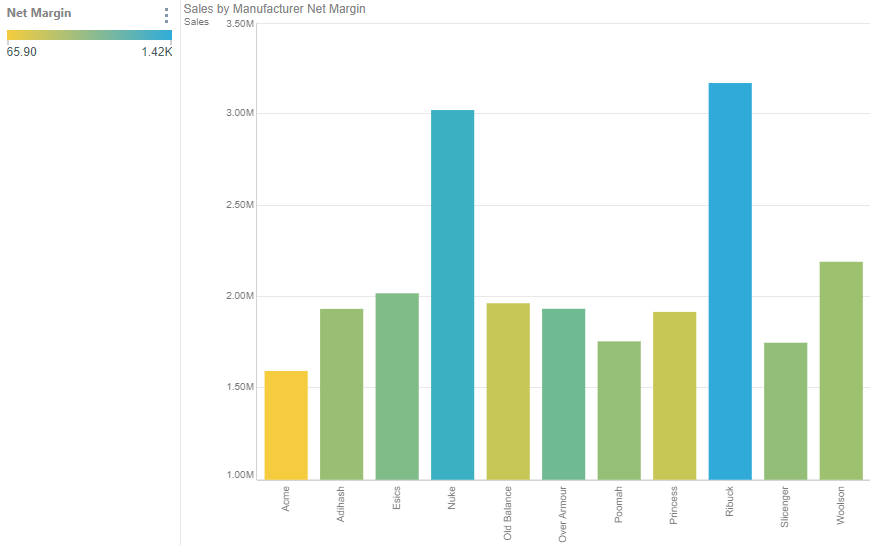
Continuous Legend
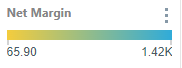
A continuous legend is one that appears as a continuous line, or box, with a color gradient reflecting the range of values for the given measure within the context of the query. Whenever a measure is placed in the Color zone, a continuous legend is produced.