Dynamic presentations are authored and shared by users in the Present module. They can include data discoveries, dynamic text, infographics, images, and more.
As a Viewer, you can access presentations that have been shared built by other users and shared with them. You can perform dynamic interactions on these discoveries, access extended functionality, print and export, and create scheduled subscriptions.
Depending on the runtime settings configured by the report-builder, you may also be able to open data discoveries in the presentation for further analysis in Discover Lite, where you can save your discovery to your own content folder.
Open a Presentation
Presentations are indicated by a red tile icon. They can be opened from the User Hub and from the Content Manager.
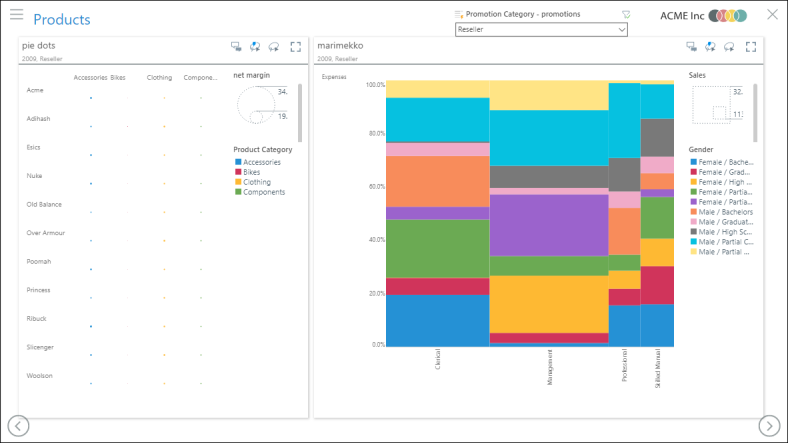
Presentation Viewer
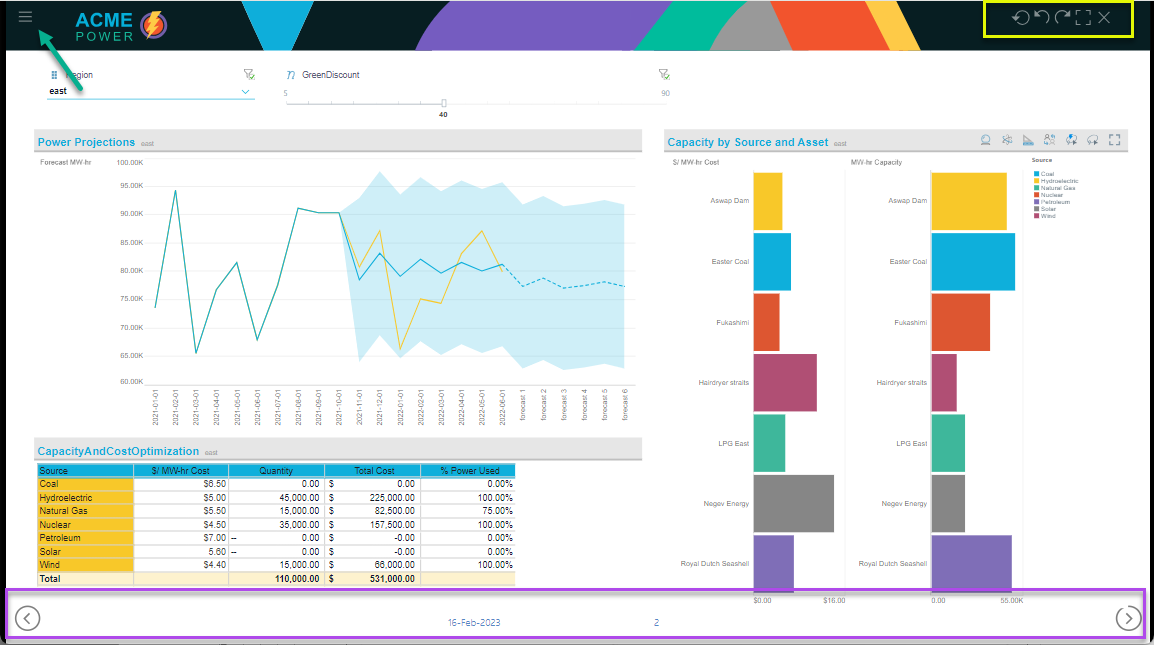
The Presentation viewer is used to navigate the slides of the presentation. From each slide you can access the macro buttons (yellow highlight below), the presentation menu (green arrow below), and the navigation buttons (purple highlight below).
Macro Buttons
Use the macro buttons for the following:
- Undo: undo the previous action.
- Redo: redo the previous action.
- Reset: undo all changes to reset the presentation - be sure to reset before exporting, as interactions at runtime will be reflected in the exported presentation.
- Full Screen: show the presentation in full screen mode.
- Close: close the presentation.
Navigation Buttons
Presentation-builders have three options for configuring navigation for a presentation: arrows, tabs, or a drop-down list of slides. Whichever type of navigation you see in the presentation, use this to navigate between slides.
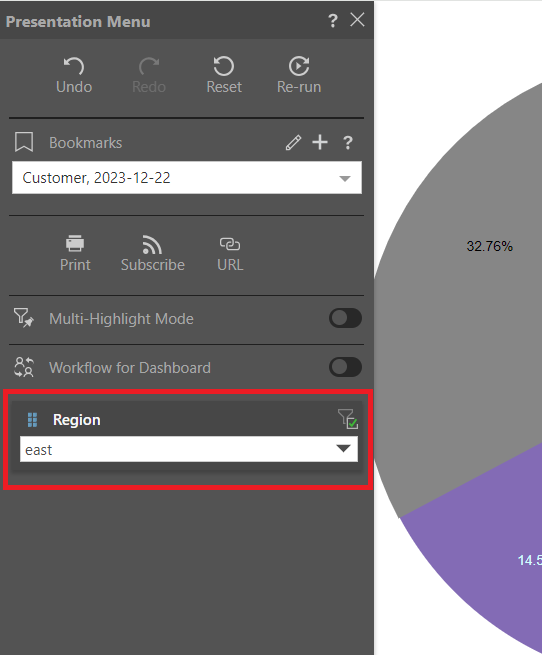
Presentation Menu
Open the Presentation Menu to undo, redo, or reset, along with the following options:
- Re-Run Queries: re-run the queries in the presentation.
- Bookmarks: save your slicer selections in a presentation.
- Print: print and export discoveries and presentations to a given output type.
- Subscribe: create a subscription schedule for the presentation.
- URL: capture a special URL that offers direct access to the current slide.
- Multi-Highlight Mode: click select multiple member elements by which to cross highlight visuals.
- Workflows for Dashboard: toggle workflows or conversations on or off for all visuals in the presentation.
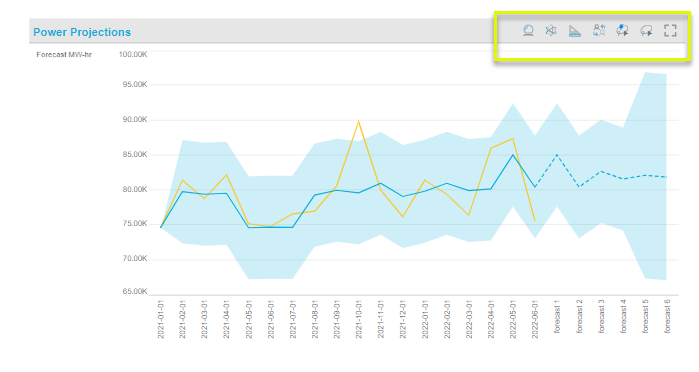
Panels
Visualization panels expose several functions along the top of the visual. Depending on the design preferences of the presentation's author, the panels may be displayed by default, or you may need to hover over the visual to display its panel functions.
The panel tools that you see are determined by the presentation-builder; you may or may not see all of the panel tools in a given visual.
- Click here to learn about panels.
Slicers
Slicers are used to filter data visualizations in data discoveries and presentations. If a content item contains a slicer, you can select value from it in order to filter the visuals driven by it. The selected slices will be displayed in the breadcrumb trial of the affected visuals.
- Click here to learn more about working with slicers in presentations.
Cross-Visual Interactions
Apply cross-filtering and cross-highlighting from a given visual to its target visuals. This lets you pass values from one visual to another via cross-filtering, or to highlight values across two or more visuals via cross-highlighting.
- Click here to learn more about cross-visual interactions.
Interact with Visuals
The visualization context menus expose a range of functions, allowing you to dynamically interact with visuals, perform further analysis on-the-fly, and discuss results with other users. Access the context menu by right clicking on the data point with which you want to interact.
- Click here to learn more about interacting with presentations.