 LinearTrendSlopeValue (PQL)
Returns the value of trend line slope after regressing the X and Y values in the function.
- Returned Output: Numeric
- Library: PQL \ Dynamic \ Grid
- Version: 2020.02.000
- Compatibility: Any content (regardless of data source) in the relevant parts of the application
Syntax
LinearTrendSlopeValue( <Numeric List> , <Numeric List> )
* Click on the function's arguments above for more details on the input values.
Comments
- The first numeric list is a listing of values representing the "X" values in the regression logic.
- The second numeric list is a listing of values representing the "Y" values in the regression logic.
- The formula returns the value of "m" in the standard linear regression model of "y=mx +b "
Examples
The example below uses the following example grid.
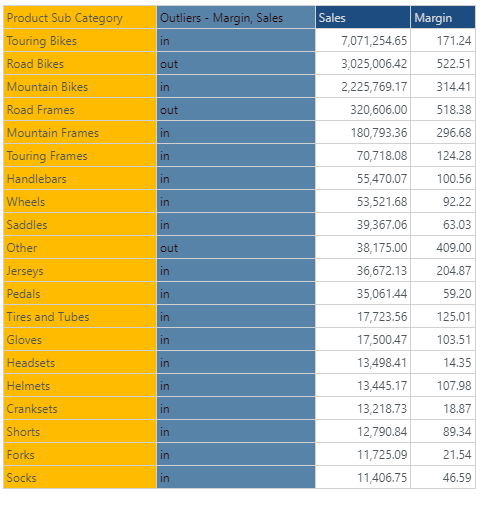
This example returns an "m" coefficient of 3151.8 assuming that the sales figures are the "y" values and the margin figures are the "x" values.
LinearTrendSlopeValue(dataSetColumn(1), dataSetColumn(0))