CovarianceP (PQL)
Returns the statistical biased population covariance amount across elements in the specified list.
- Returned Output: Numeric
- Library: PQL \ Semantic \ Statistical
- Version: 2020.10.000
- Compatibility: Pyramid Query Language (PQL) data sources
Syntax
* Click on the function's arguments above for more details on the input values.
Comments
- There are 2 variants of the function: one for unbiased population and one for the biased population.
- List parameter should be a list or set of elements from an existing hierarchy in the model.
- The first data point or tuple is required. The second is optional. Both are used to describe the values used to generate the covariance. If not supplied, the default measure or the query context will determine this value instead.
- For details on how to employ and use this function see the semantic calculation overview.
Different Function types
- This function is like the MDX covariance "N" function; it calculates a biased covariance across a list of elements in a hierarchy or attribute.
- To use a simple covariance mathematical operation on a list of numbers, use the Common library function.
Examples
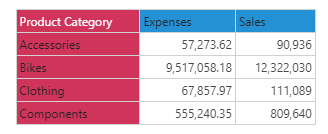
This example returns the biased covariance of expenses to sales across the product category in the product table/ dimension, using the sample demo model:
CovarianceP( {AllMembers([products].[Product Category])}, ([measures].[data Expenses]), ([measures].[data Sales]) )
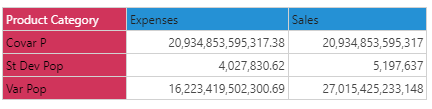
Below, using the sample data of the 4 product categories we can use the above formula to calculate the biased covariance. Looking at the list, the statistical covariance value using sales and expenses is 20,934,852,595,317: