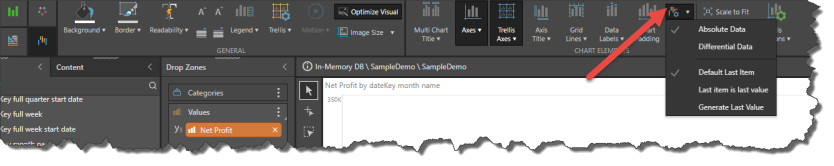
The Waterfall Type drop down, in the Component ribbon, exposes several variations of the waterfall chart.
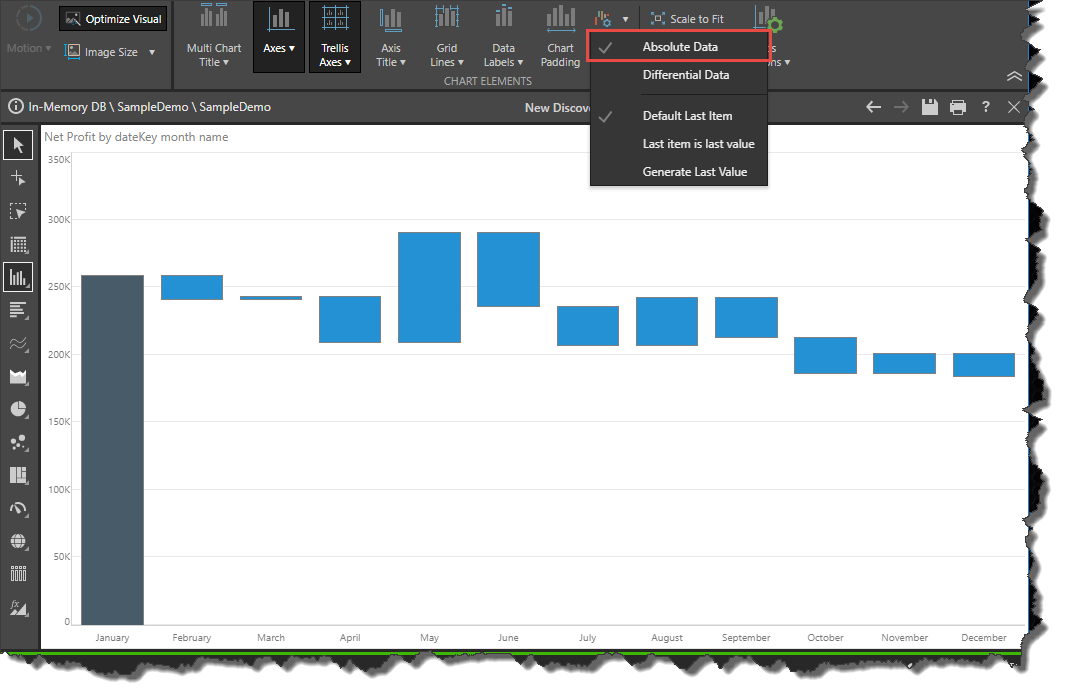
Absolute Data
The default data type is absolute data, meaning the chart is adjusted to suit absolute values. If the data set in the query has absolute values, choose Absolute Data.
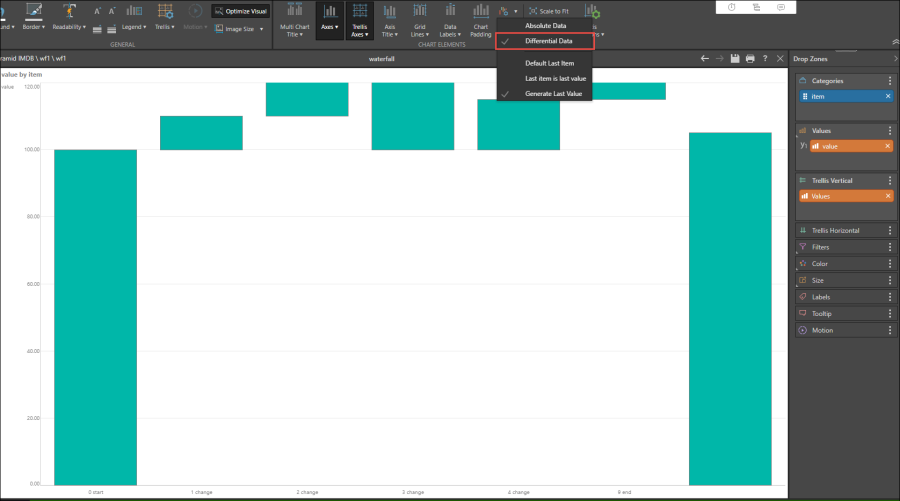
Differential Data
If your database has differential values that you want to add to the chart, select Differential Data. This will ensure that the chart is optimized to display the difference, rather than absolute values.
Last Item
There are a few ways that you can display the last column in the chart:
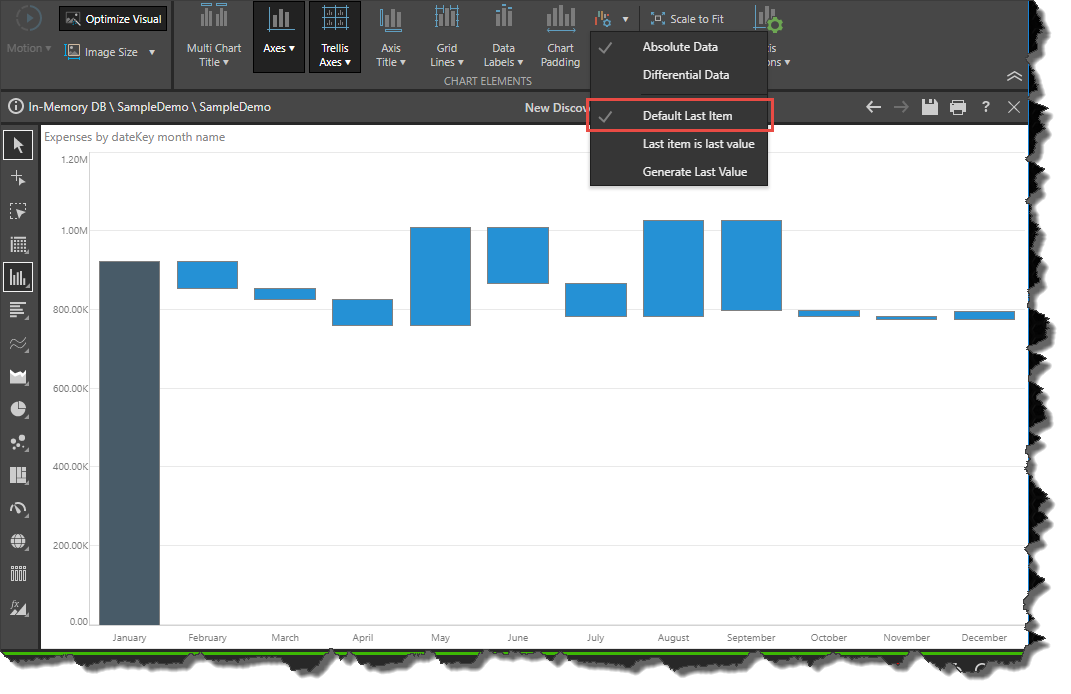
Default Last Item
This is the default option, and the last item will be calculated and displayed in the same manner as the previous items.
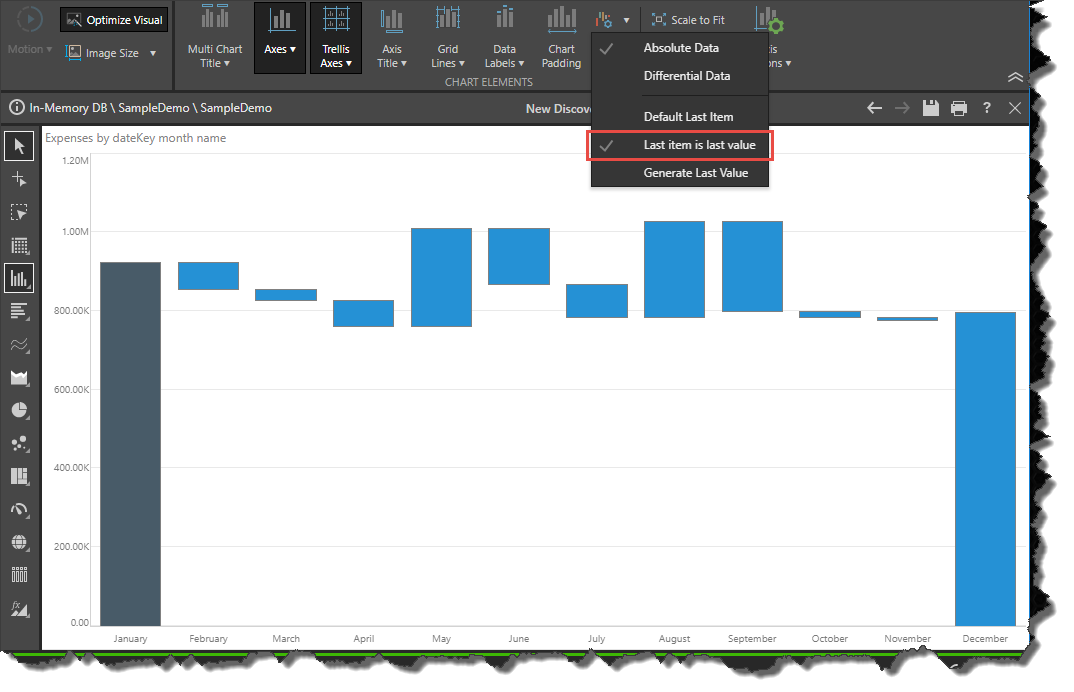
Last Item is Last Value
The last column will start at 0 and end at the value of the last item. It is not logical to use this option when looking at differential data, but it can be a good way to view absolute data.
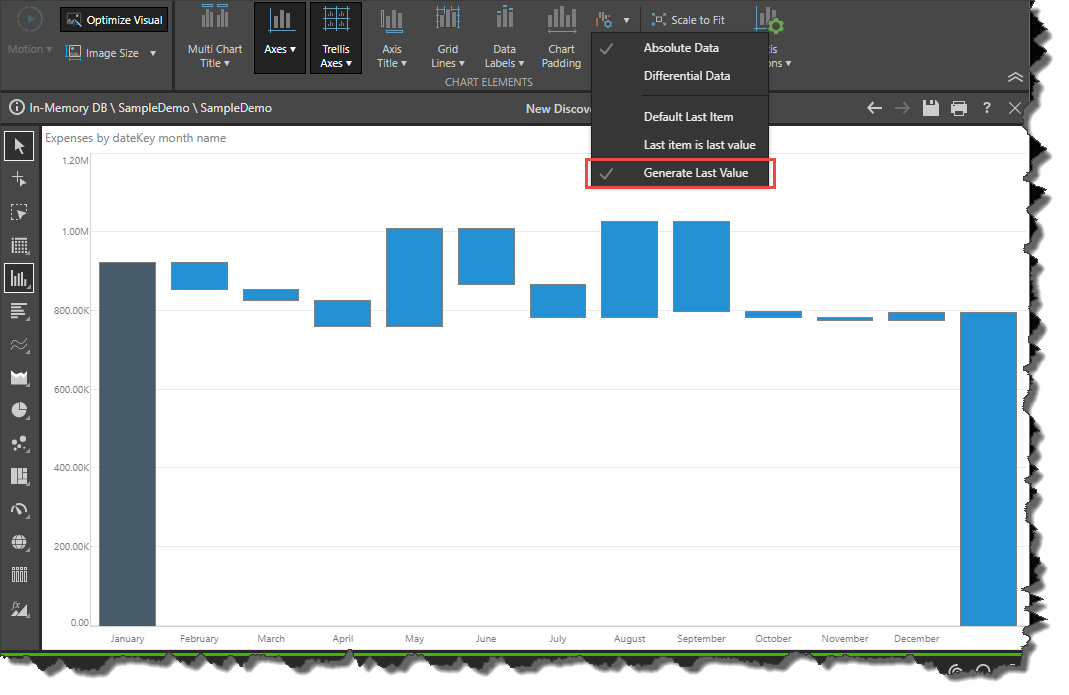
Generate Last Value
Generates an additional column that starts at 0 and ends at the value of the last item.