Whenever a hierarchy or measure is added to the color or shape zone, a legend is produced. Not only can you change the formatting of these legends, but you can also edit the formatting for the legend's individual elements or values; this is called series editing.
There a 2 different types of legend: discrete legends display a discrete list of elements in the given hierarchy, or a list of measures, while continuous legends display a range of values for the given measure.
Discrete Legend
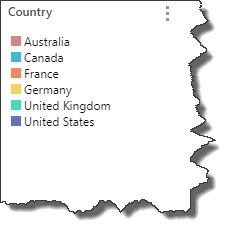
A discrete legend is one that consists of a list of elements or measures, which are color coded according to the color assigned to them in the visual. When a hierarchy or list of elements is added to the color or shape zone, a discrete legend is produced.
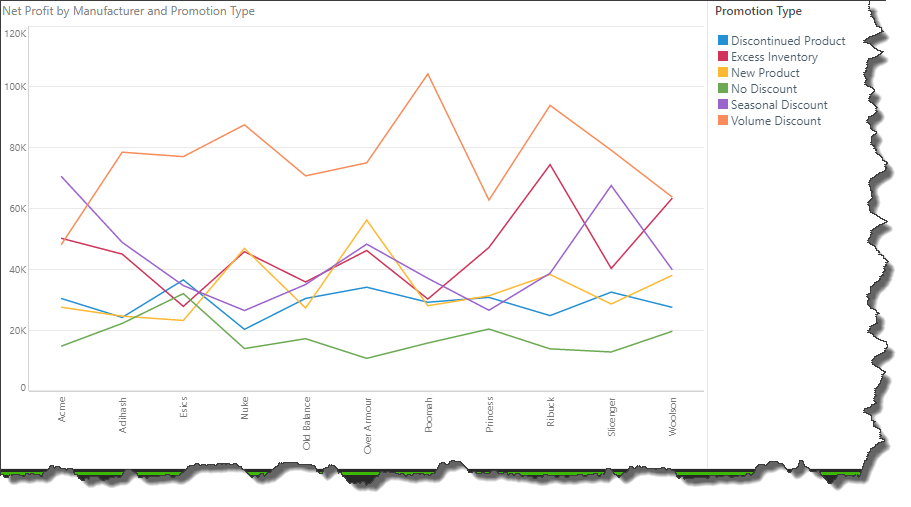
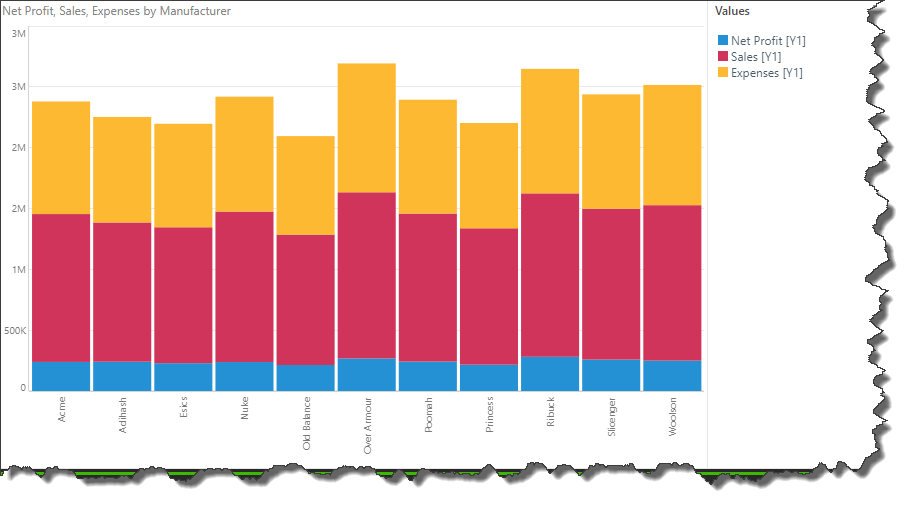
This kind of legend is also produced when building multi-measure charts, like combo charts, stacked measure charts, and multi-measure pie or doughnut charts; in this scenario, each item in the discrete legend corresponds to a measure in the visual.
Each item in the discrete legend corresponds to an element or measure in the visual.
Continuous Legend
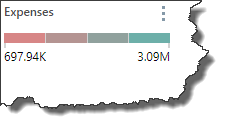
A continuous legend is one that appears as a continuous line, or box, with a color gradient reflecting the range of values for the given measure within the context of the query. Whenever a measure is placed in the Color zone, a continuous legend is produced.
