Interactive Content
Discover
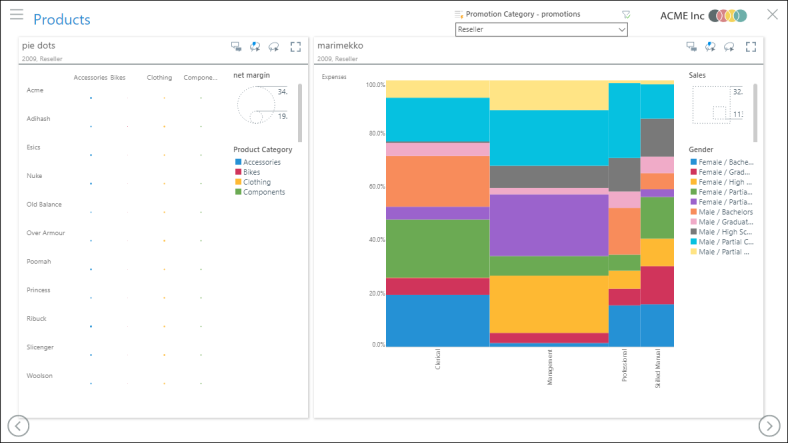
Data discoveries are indicated by a green column chart icon. These are data visualizations which have been build in order to answer business questions in your organization.
- When viewing a discovery, you can toggle the arrows to view the previous or next discovery.
- Open the viewer menu to undo or redo an action, export and print the discovery, or access the help.
- Click the conversation icon to view or start a conversation.
- Right click on a data element in the visual to open the context menu, from which you can interact with the discovery.
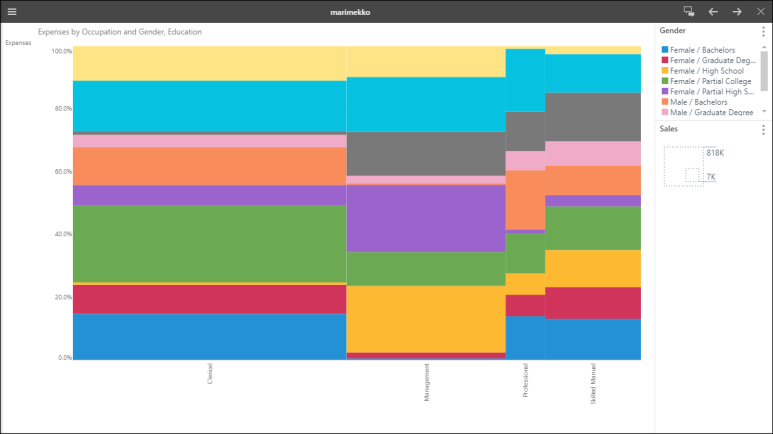
Legend and slicer panels can be moved to various locations around the canvas. Hover over the panel heading; when the cursor shows as a four-pointed arrow, drag the panel and drop it into a docking zone; docking zones display a blue highlight as you drag over them.
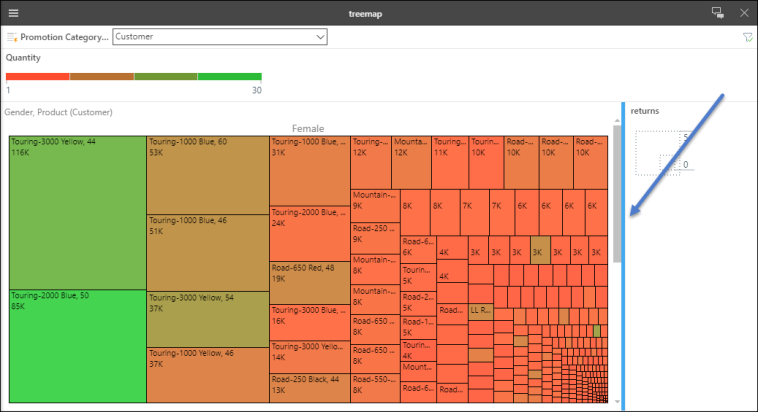
In the image below, the Quantity legend is being moved beside the Returns legend (blue highlight).
Presentations
Presentations are indicated by a red tile icon.
- Toggle the arrows to navigate back and forth through the slides.
- Open the Presentation menu to undo or redo an action, or reset the presentation, export and print the presentation, and access the help.
- Use the screen icon to full-screen the presentation, and use the arrows to undo, redo, or reset.
- Right click on a data element to interact with it via the context menu.