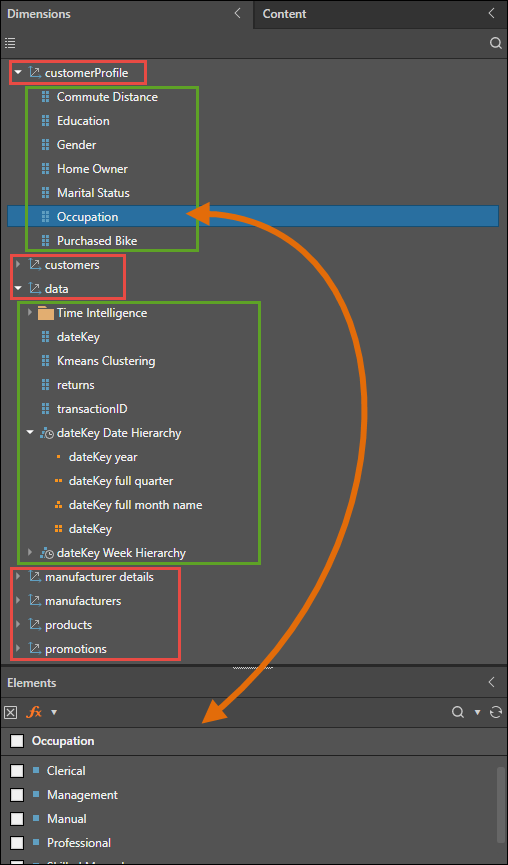
Dimensions correspond to tables that were imported from the datasource, and they are the highest level of structure within the data model. The Dimensions Tree consists of the data model's dimensions (red highlights below), which contain the model's hierarchies. When a dimension is expanded, the next level of the model's structure is exposed; this level is made up of the model's Member Hierarchies (green highlights).
The member hierarchies correspond to the columns or attributes within each table imported from the data source. Along with measures, member hierarchies are added to the drop zones to build queries.
Member hierarchy trees are made of Member Elements; these are the objects in the column imported from the data source. A hierarchy's member elements can be browsed and added to the query from the Elements Tree (orange arrow).
Dimension Tree Features
Folders
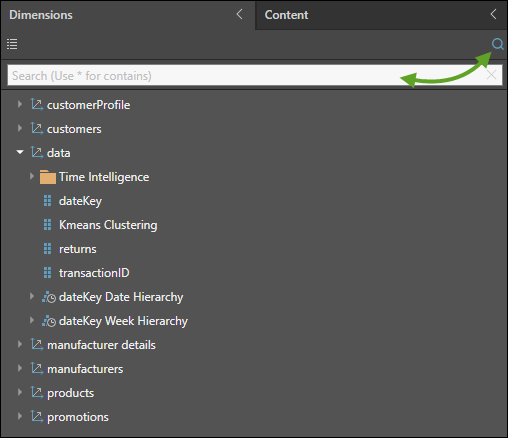
Depending on the way the data model was configured during the ETL, hierarchies may be organized into sub-folders within the dimensions. For instance, in the image below the Time Intelligence folder (red arrow below) in the Data dimension contains all the hierarchies generated by the Time Intelligence node.
When working MS OLAP, Tabular, SAP HANA, and SAP BW models, hierarchies will be organized according to the structure in the datasource.

Hierarchy Types
There are three types of hierarchy: attribute hierarchy, regular hierarchy, and drill path hierarchy. An attribute hierarchy (orange highlight above) has a "flat" structure and corresponds to the columns or "attributes" imported from the datasource. Attribute hierarchies are denoted by a "6-pack" icon. Both regular and drill path hierarchies are denoted by a "pyramid" icon (green highlight), and consist of multiple attribute hierarchies, arranged into levels that enable drilling. and expand and collapse interactions.
Regular and drill path hierarchies in SQL models are configured during the ETL; when querying MS OLAP, Tabular, SAP HANA, and SAP BW models, the hierarchy structure is organized according to the datasource.
Properties
Hierarchies can be assigned a category or property to enhance performance. For instance geolocation hierarchies should be assigned to the appropriate type in order to enable mapping.
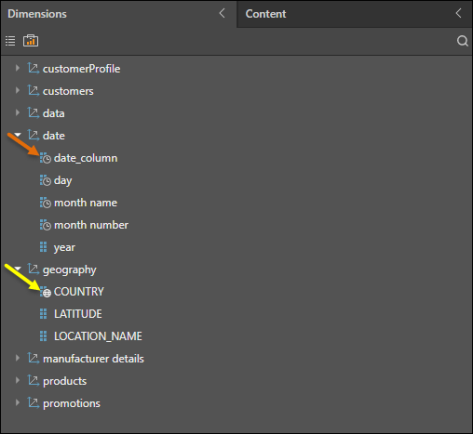
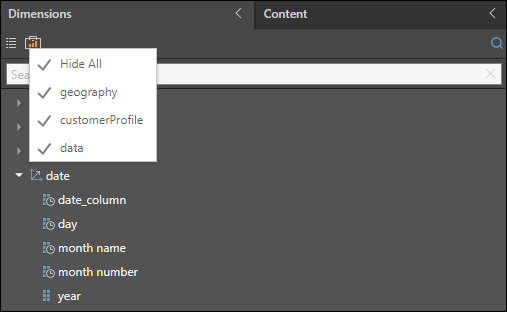
In the image below, several hierarchies in the Date dimension have been assigned to a date/ time property, as is indicated by the clock icon (orange highlight). The Country hierarchy has been assigned to a geolocation property, which is indicated by the globe icon (yellow highlight).
List View
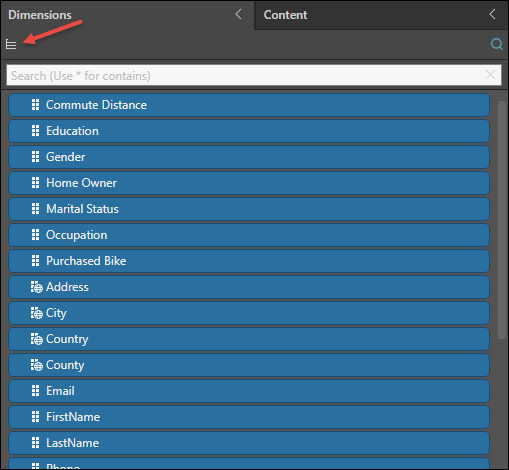
By default, the hierarchies are displayed in the format of the dimensions tree, with each dimension containing hierarchies. You can toggle the List View button (red arrow below) to view all the model's hierarchies in a scrollable list. To return to the tree view, toggle the button again.
Measure Group Filtering
When working with MS OLAP and Tabular models, the Measure Groups button will be exposed (next to the List View button). Click Measure Groups to show or hide specified dimensions. Click here to learn more about measure group filtering.
Search Dimensions
Click the search icon to expose the search bar (green arrow below), where you can search for a dimension or hierarchy. To close the search bar, click the search icon again.
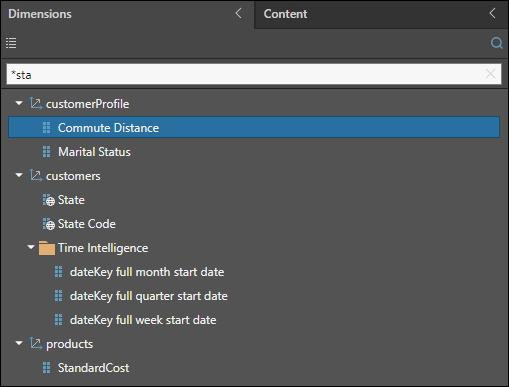
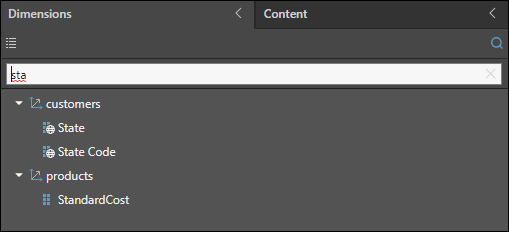
By default, the search will return items beginning with the given string. In the example below, the string "sta" is searched, returning 3 hierarchies beginning with "Sta".
To search for dimensions or hierarchies containing the given string (rather than starting with it), place an asterisk * before the string. In the example below, the string searched is "*sta", which returns several dimensions and hierarchies containing the string "sta".