Transaction logging provides a listing of all transactional queries run by users in the analytics tools against data sources. The transaction logs do NOT include any queries run against the repository.
Transaction logging is enabled by default. To change the log settings, go to The Settings > Logging to enable this feature.
Benchmark Log
If enabled, the transaction log viewer will also show a deeper analysis of query performance known as the Benchmark Log.
The Benchmark is disabled by default. Go to The Settings > Logging to enable this feature.
Benchmark logging can significantly slow the performance of the platform. They should be turned on for diagnostics only and then turned off.
Transaction Log Details
The transaction log page is broken into 2 panels.
Top Panel
The top panel shows a summary of all transactions processed :
- the target data source (server)
- the Pyramid processing server (run time engine)
- the database type
- the database name
- the user
- time stamp of the transaction;
And high level stats on the transaction and query. This includes:
- Result size: the number of cells (rows x columns) in the query result
- Connection Time: the time is took to establish a connection in milliseconds
- Query Time: the time it took for the data source to execute and return the query in milliseconds
- Post Query: the time Pyramid spent on processing the query result in milliseconds
- Engine: the total time needed to submit the query and process it before returning it to the client (Connection + Query + Post) in milliseconds
Bottom Panel
The bottom panel is broken into 2 sections: basic transactional detail and the more advanced benchmark detail.
Transaction Data
The panel shows specifics and the syntax for any selected transaction.
- The raw SQL or MDX query run against the data source. This can be used independently to optimize certain databases
- Query info : a break down of how each component of the query performance
Benchmark
The benchmark logs are an extension of the transaction logs - providing deeper analysis of the query transactions for optimization purposes. The panel shows specifics for any selected transaction, showing each stage in the query pipeline. It will not be available if benchmark logging is disabled.
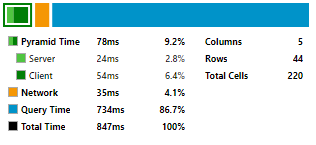
- The graphic on the left is used to summarize the times and give a bird's eye view of the pipeline. The graphic is very useful in diagnosing performance issues and separating out Pyramid processing from database processing from network latency.
- Pyramid Time represents the time allotted to Pyramid processing on the server (pre and post) and the Pyramid web client
- Network represents the time taken to send and receive data across the network between the client and server
- Query Time represents the time taken to connect to a data source, submit the request, for the data source to process the request and return a response to Pyramid.
- The rows and columns provide metrics on the size of the result.
- The grid on the left highlights each stage and the time taken to resolve each element in the pipeline from client to server, to database and back to client.
It is beyond the scope of this help article to explain each item. These details are for Pyramid engineers when trying to diagnose performance issues for a customer.
If benchmark logging is enabled, the benchmark summary graphic is also available from the "App Tab" in the full client interface.