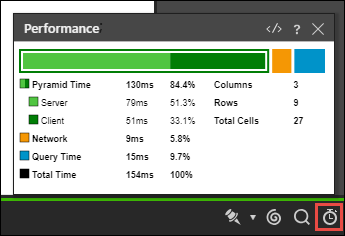
The Benchmark Performance Dialog displays information relating the performance of the query, including the time taken for the query to run, and the number of columns, rows, and cells in the query. This information enables the user to review the query performance and assess whether there may be a performance issue by comparing the query time with the query size.
Access the Performance Dialog
Click the clock icon to open the performance dialog. This displays information about the query's performance:
- Pyramid Time: Pyramid's processing time. This is split into server processing time and client processing time.
- Network: the time it takes to get from the server to the client.
- Query Time: the time it takes to run the query (this is dependent on the data source).
- Total: the total time to run the query.
- Columns: the number of columns in the query.
- Rows: the number of rows in the query.
- Cells: the number of cells in the query.

Query Text Window
Click the arrows at the top of the dialog to open the Query Text window, where the MDX syntax behind the query will be displayed and can be copied to clipboard. If cache is enabled, you may see the message "Query Cache" in the window. To resolve this, close the window and disable cache under Cache Options in the Query ribbon.
This feature must be enabled from the Admin console.