Once you've saved your KPI, you can add it to queries in Discover.
STEP 1
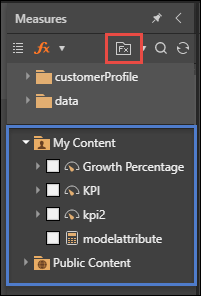
Under Measures, click  to show business logic. The folder tree will appear in the lower window.
STEP 2
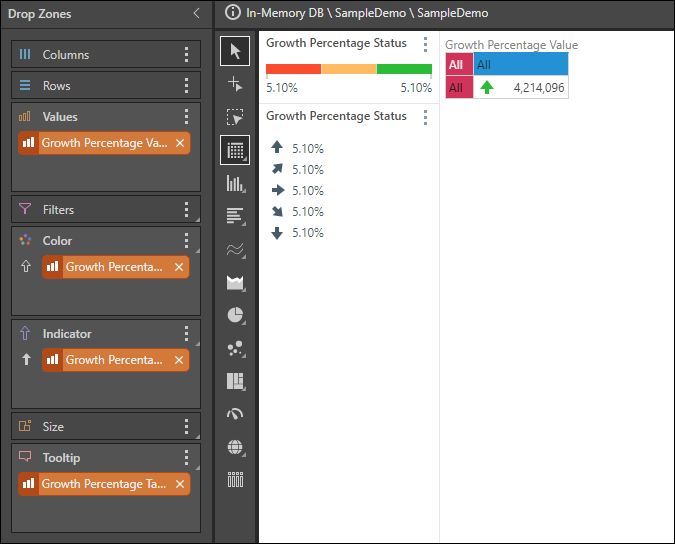
Find the KPI in its folder location, and select it to add it to the query. Each of the KPIs values (actual, target, and status) will be added to the drop zones.
STEP 3
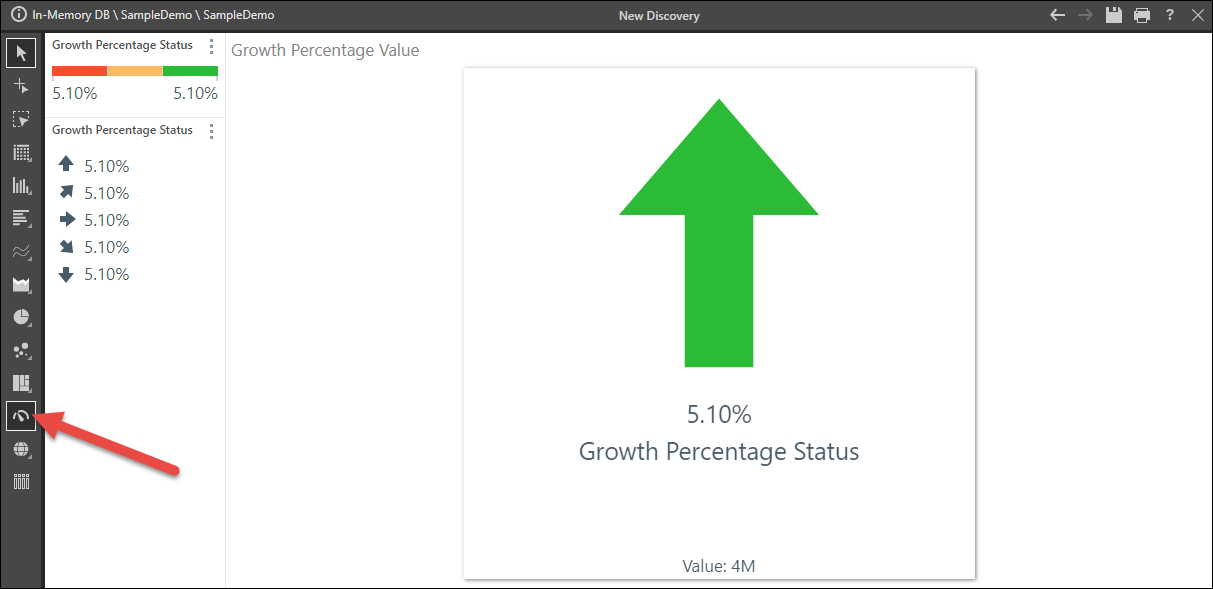
Select the required visualization; here, a the KPI is visualized as a gauge.
STEP 5
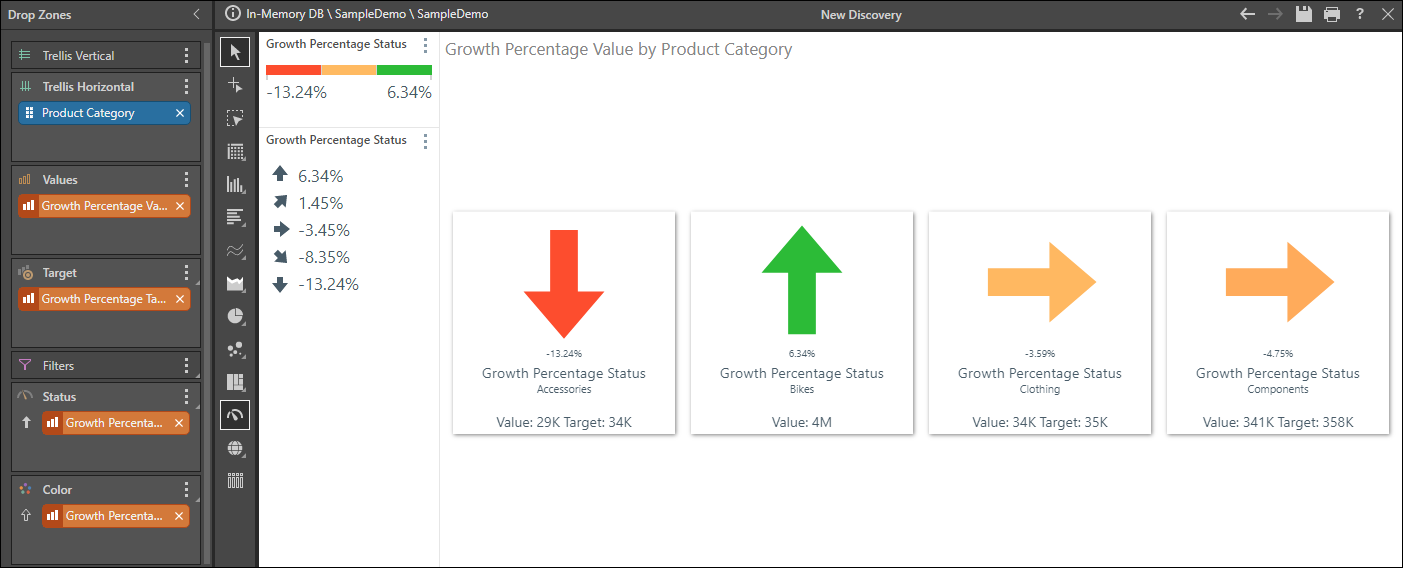
Continue adding to the query as required.
As usual, select the required visualization, including gauges. To learn about gauges click here.
Other Options
- Select KPI values: you can select only specific values from your KPI. For instance, select the Status to see only the status indicator without numeric values.
- Status indicator: move the Status chip over the Indicator icon to see additional indicator options. You can drop the chip onto a different indicator style or indicator logic.
- Drop zones: you can move the KPI chips between the drop zones to see your information differently. For example, move the Values chip from Tooltip to Columns, to see the target value in the grid.
- Color zone: move the Color chip into the Color sub-menus to change the color indicators and color logic. Click here to learn more.
Conditional Formatting Dialog: use the advanced dialog to fully customize the KPI banding. Click here to learn more.