Tables
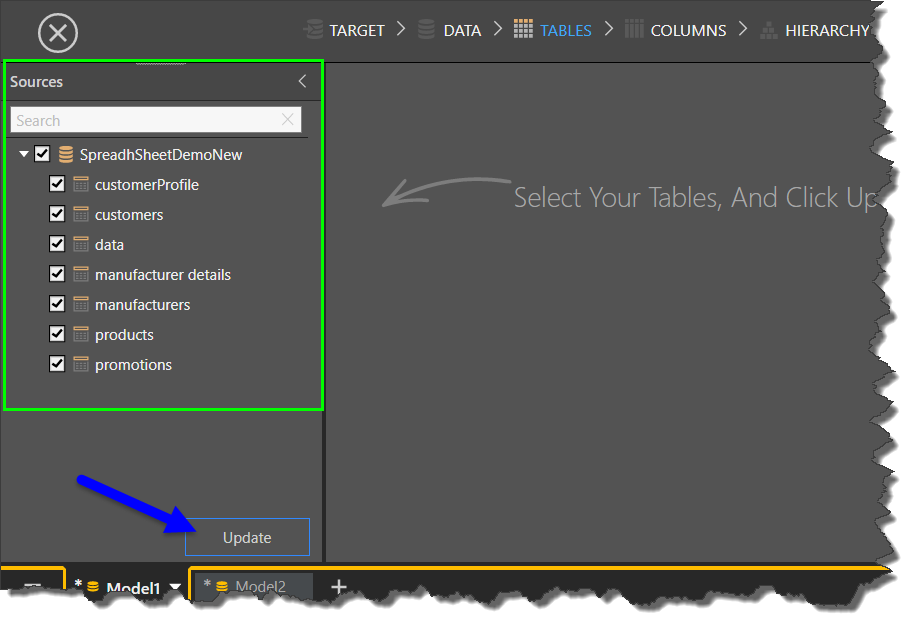
At this stage, you need to select which tables to import from your given datasource. Each selected datasource will appear on the left in the Sources panel. Expand the datasource to show its tables and select the tables you want to import (green highlight below). To import all tables in the datasource, select the datasource's checkbox; all tables will be selected automatically.
To confirm your table selection, click the 'Update' button (blue arrow).
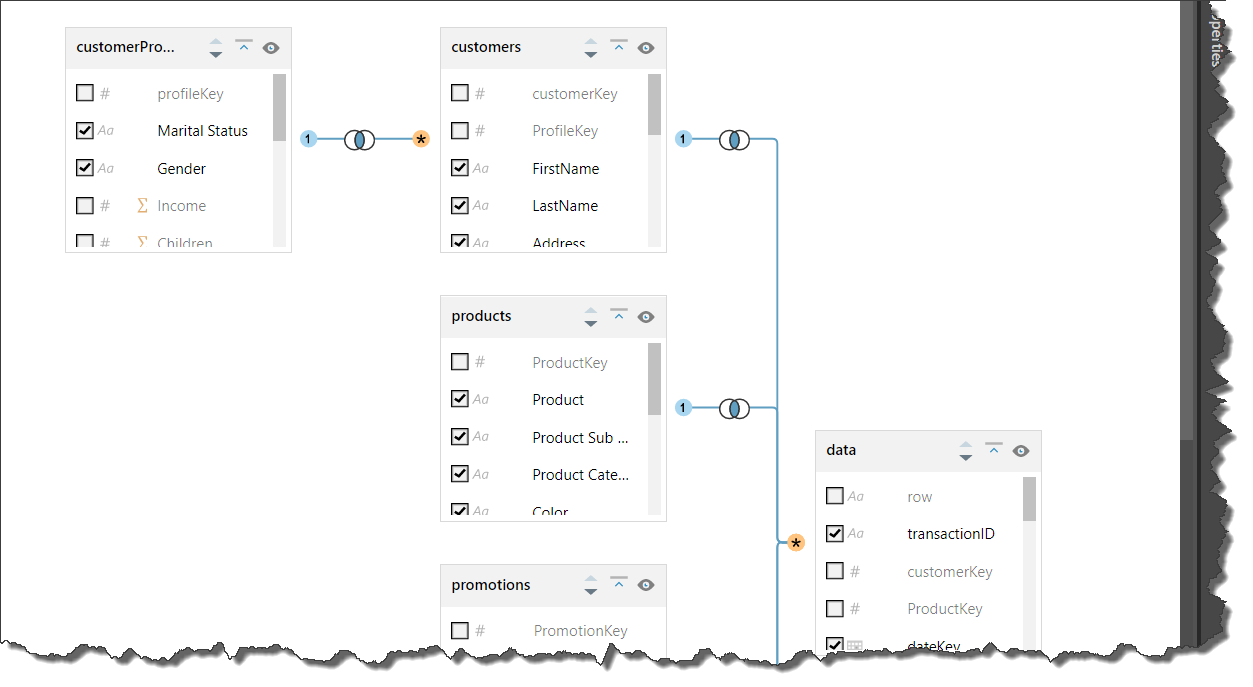
The selected tables will be loaded on the canvas; Pyramid uses heuristics to add relationships between the tables.
Edit Joins
Pyramid automatically adds joins between the tables in the dataset, using heuristics to determine how the tables best fit together. You can edit joins as required. To edit a join, click on it (blue arrow below); this will expose both the join's context menu and its Properties panel (green highlight).
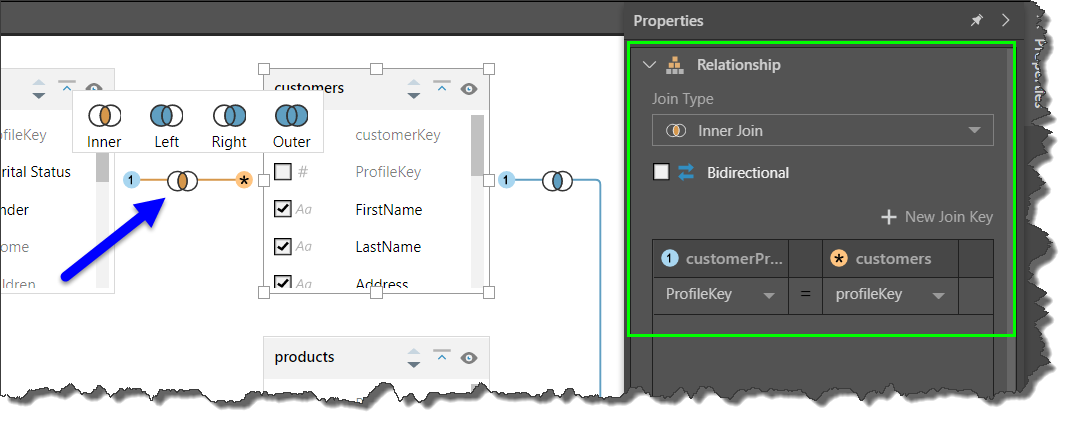
From the join's context menu, you can change the join type. From the join's Properties panel you can:
- Change the joint type from the 'Joint Type' drop-down.
- Make the joint bi-directional.
- Edit, add, and remove join key columns.
Table Metadata
Aside from editing relationships between the tables, you can also edit the metadata for each table, and its columns.
Edit Table Metadata
Left click on a table to expose its Properties panel (green highlight below), or right click on the table to expose its context menu (blue highlight). The table's metadata can be edited from both these locations.
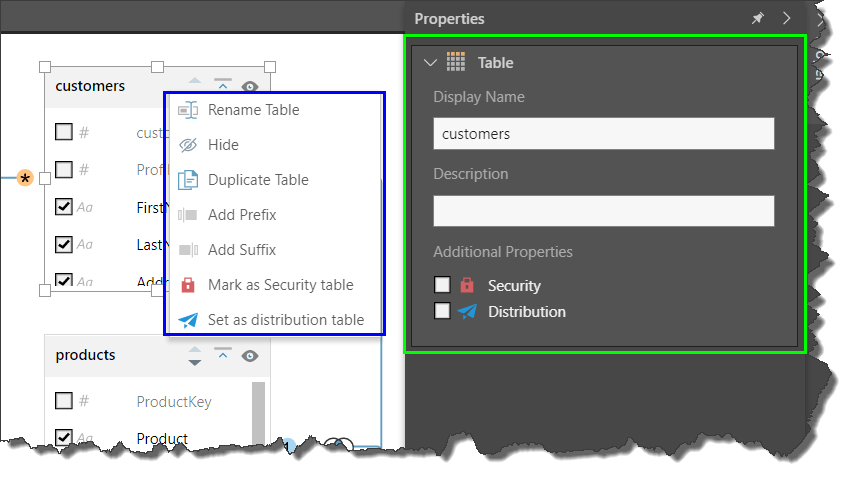
You can edit the table name and description, hide or duplicate tables, and add a prefix or suffix to a table name and the column names in the table.
You can edit metadata for columns in the same way; right click to expose the context menu, or left click to expose the Properties panel:
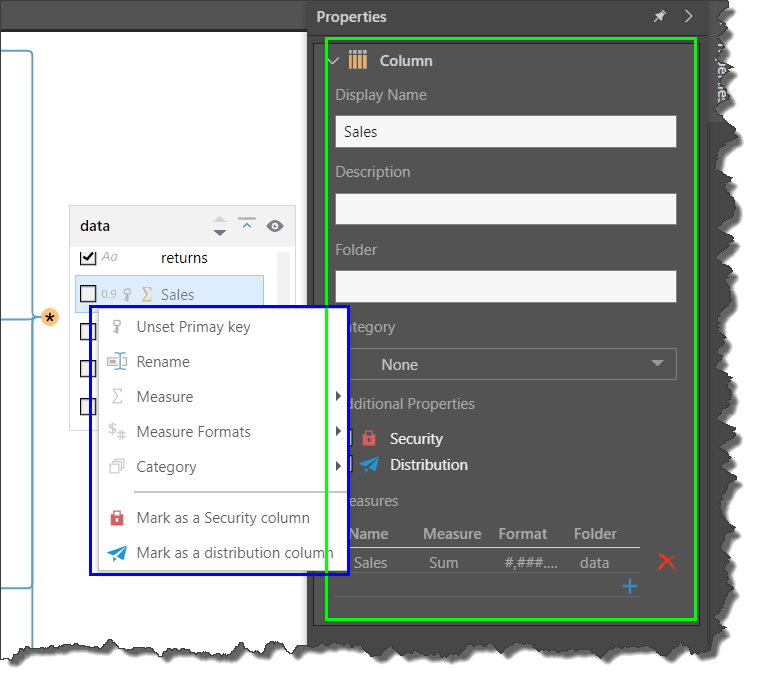
You can change a column name, description, and folder location. You can also assign a column to a category or a measure, and define relationships between columns across different tables.
- Click here for details about editing table metadata.
Measure Editor
Pyramid uses heuristics to detect measure columns and assigns them to the Sum measure aggregation type. Open the Measure Editor to change the measure's name, description, aggregation, format, and folder location.
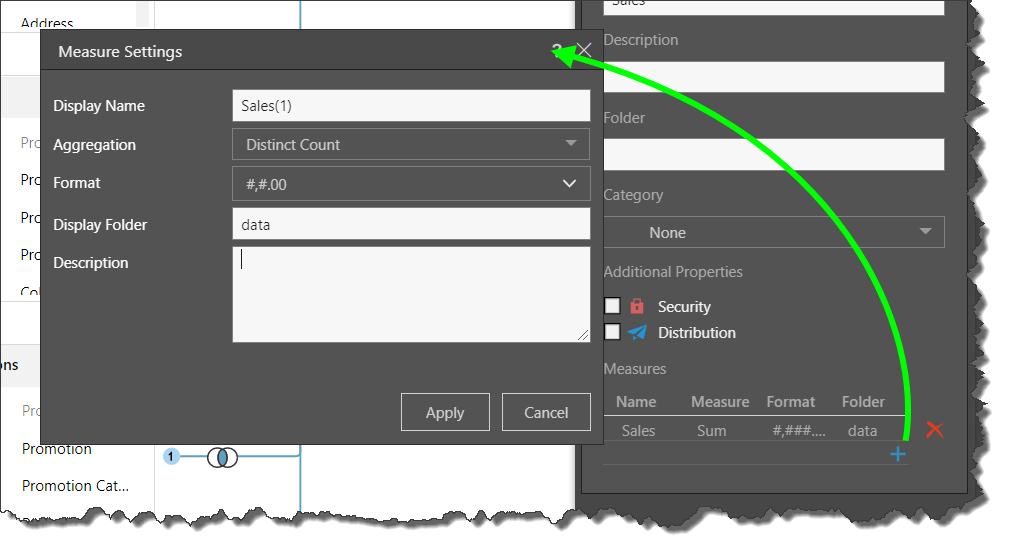
Open the Measure Editor by left clicking on the measure column; this will expose the measure's Properties panel. At the bottom of the Properties panel, under Measures, you can edit the existing measure by clicking on its listing. You can also add another measure type by clicking the plus sign. Configure the measure from the Measure Settings dialog (green arrow below).
In the example below, the Sales column was automatically made into a measure with an sum aggregation. It was then added with a distinct count aggregation as well.
- Click here for details about the Measure Editor.
Security and Distribution
Security Tables and Columns
You may have tables or columns that you want hidden from the data model, but not removed altogether. Security tables and columns are hidden from the model, so that users cannot add them to queries. However, they can be seen by admins when configuring member security.
Member Security allows admins to define security preferences for specific member elements within each column in the data model. This enables you to regulate which user roles will have VISIBILITY to which members in the hierarchy of a data model. Admins can set member security to security tables and columns, and then build custom sets targeted to specific user roles using the PQL identity functions. Tables or columns used for this purpose may contain data about users, like names, location, domain, user role, or email. For example, your admin might create member security that ensures that users in the security column 'Users' can only see data from their own country or region in the data model.
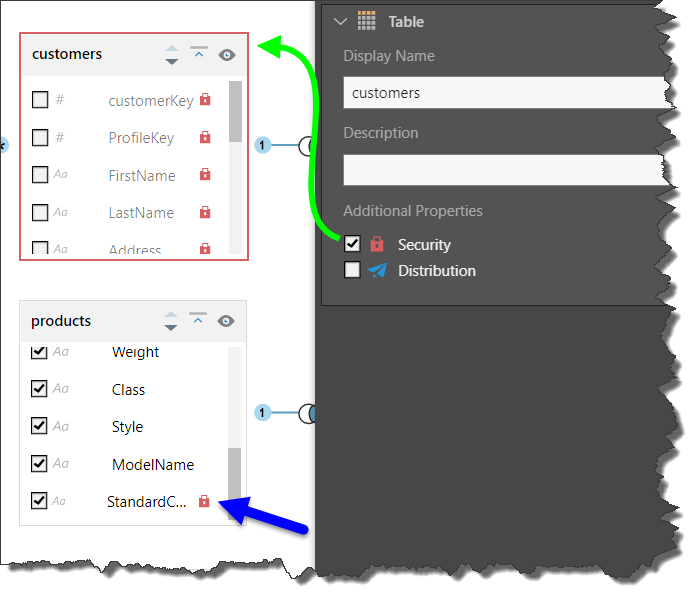
In the example below, the entire Customers table has been set as a security table, and the Standard Cost column in the Products table was set as a security column.
Distribution Tables and Columns
Distribution tables and columns are not visible in the data model, and therefore cannot be added to queries. They are visible only from when configuring a data mapping for publication distribution. A dynamic distribution of a publication based on a data mapping enables you to create a dynamic list of recipients (from the data model) to whom the publication will be distributed. So, you may have a table or column containing Pyramid user names, roles, emails etc, for the purposes of distribution. To ensure that this data will not be visible in the data model, enable Distribution for the table or column.
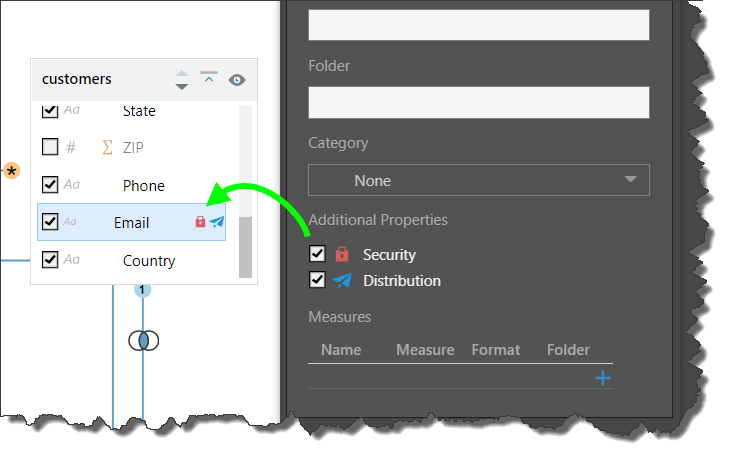
A table or column can be marked as security or distribution from both its context menu and its Properties panel. The table or column will then be denoted with the relevant icon(s) (green arrow below).
- Click here for details about security and distribution tables and columns.