Progress Panel
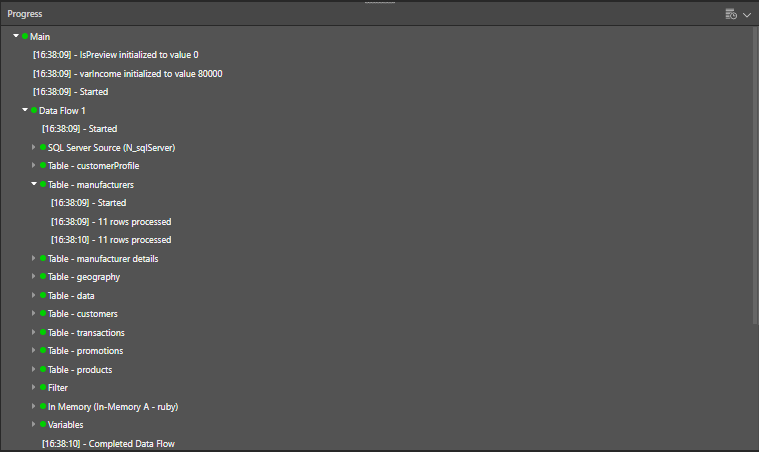
The Progress Panel shows each node from the Model flow. The status for each item is shows by the colored circle beside it:
- An empty green circle indicates that the job is still in progress.
- A full green circle indicates the job was completed successfully.
- An orange circle indicates that the job was completes with warnings.
- A full red circle indicates the job failed.
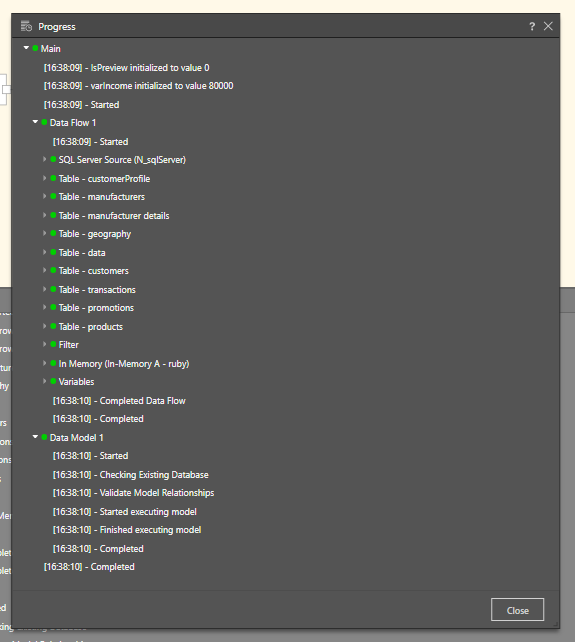
From the Model Progress log, you can review each component (Node) of the Model flow. The Parent node is labeled 'Main'; when the model is processed successfully, the Main node can be expanded to show:
- The time of initialization for any variables in the Data Flow
- The time processing was started
- The Data Flow
- The Data Model
- The time model processing was completed

The Data Flow and Model nodes can be expanded to review additional details.
The Data Flow will show the time that the data flow started processing, and a list of all nodes in the data flow. Each node listing can be expanded to show:
- The time that the node began being processed.
- The number of rows processed.
The Data Model node can be expanded to show when model processes was started and completed, and the time of job execution for validation of model relationships and model execution.

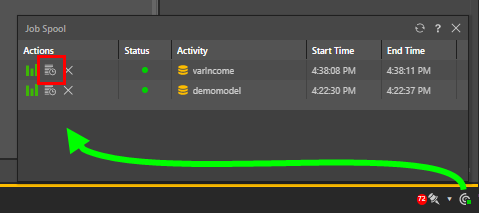
The Model Progress Log can also be accessed via the job spooler:

Once the ETL Progress button is clicked (red highlight above), the process log will be displayed:
