Cross-Filtering
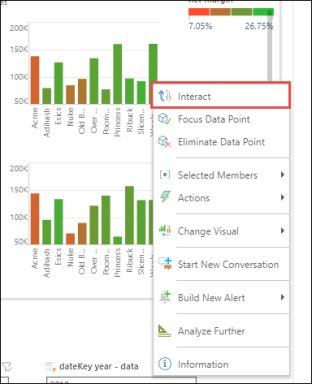
A presentation author may choose to create cross-filtering for visuals. This allows you to apply a data point from one visual as a filter to other visuals. If this option has been configured on a visualization, you'll see the Interact function at the top of the context menu when you right-click on a data point in the relevant visual(s).
Single Data Point Selection
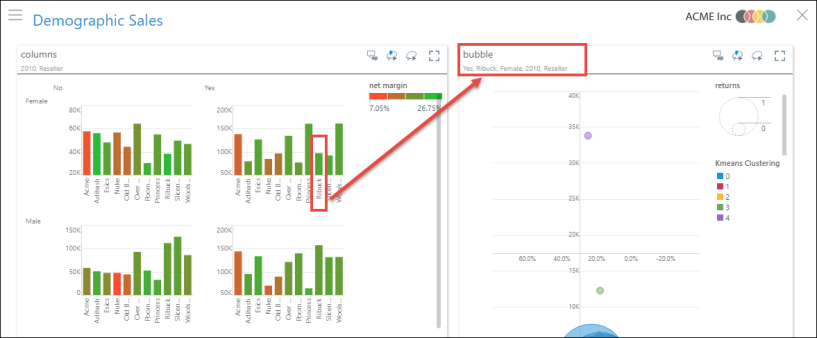
To cross-filter by a single data point, right click on the data point that should act as a filter; click Interact from the context menu. The visual(s) configured to interact together will be filtered accordingly.
Multi-Data Point Selection
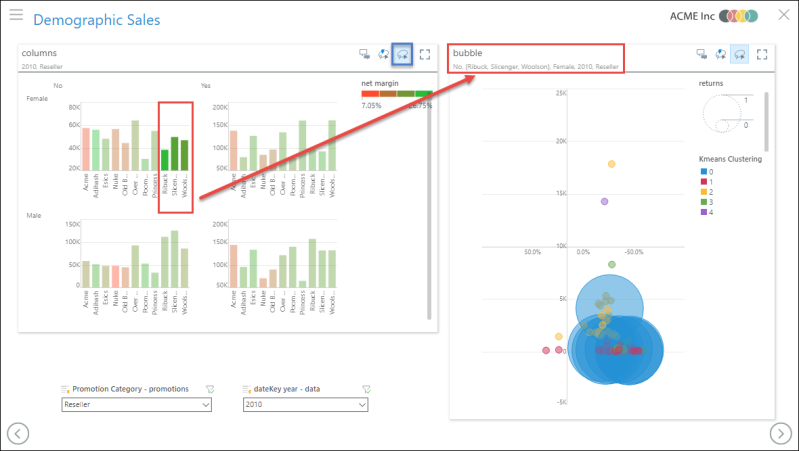
If cross-filtering by multiple data points was enabled by the presentation author, click the Lasso Selection Tool. Then drag-select the data points that should act as a filter and right click on the selection; click Interact from the context menu. The visual(s) configured to interact together will be by the chosen data points.
Remove Interact Filters
To remove cross-filtering, click anyway on one of the cross-filtered visuals. Alternatively, use the undo and reset buttons.