This option appears for Cartesian, radar, and plotted charts. Grid lines are disabled by default on the chart background, to help make the chart more legible
Toggle the Grid Lines button to show or hide grid lines in the plotting area when working with Cartesian, plotted, and radar charts.

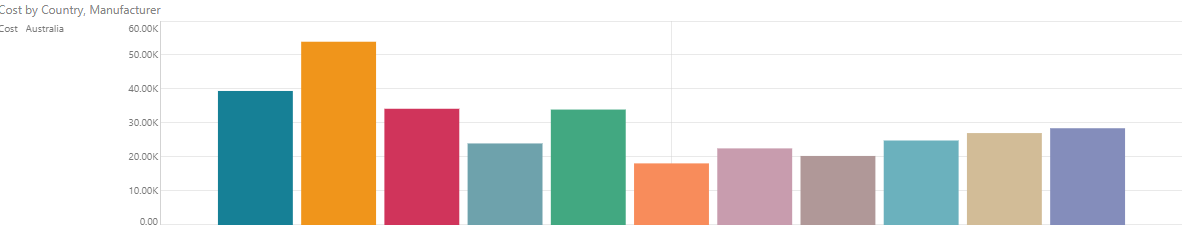
Here, grid lines were enabled:
Here, grid lines were disabled, making the background of the plotting area blank: