 Present
Present is one of the two modules that allow users to share data visualizations. Present allows users to create fully customized charts, infographics, and other elements to create eye-catching, dynamic, well-organized presentations.
The Present interface gives users the opportunity to design and create fully customized interactive real-time dashboards for presentations. Users can take content created in the Discovery and Illustrate modules to create fully customizable dynamic visualizations to build interactive dashboards to create effective and engaging visual presentations. Users can add slicers and dynamic text and images to slides, which can be used during presentations.
- Click here to see other Present Tutorials Video Library
Users can expand the Presentations by interacting with the content. The data can be sliced, diced, and filtered. Additional insights can be discovered using the AI tools, as well as Natural Language Queries (NLQ). Users can save the results that they obtain in their own folders for further analysis.
The presentation slides display the Dashboards, where different data visualization formats can be displayed.
These visual elements can include:
- Charts
- Infographics
- Text
- Slicers
- Third Party information
- Images
- Data Driven Dynamic Elements
For creating reports in distributable format (PDF, Word, PowerPoint), use thePublish interface. The Publish module is used to create reports that can be shared with other recipients. The reports can be sent either as “one offs” or can be updated and regularly sent to users who subscribe to the report.
Launching Present
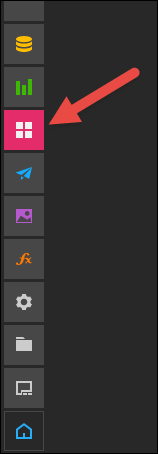
Launch the Present module from the Pyramid homepage by clicking the present icon from the left-hand navigation panel.
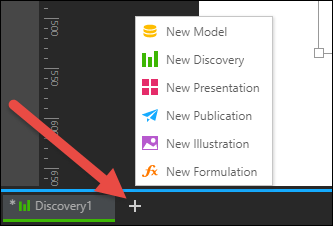
Alternatively, if you’re currently using another module, click plus sign along the bottom panel and select New Presentation from the pop-up menu.
Now you can begin building your presentation.