The range slider can be added to Cartesian charts (bar charts, column charts, and so on) to allow the reader to zoom in and out of particular parts of the chart for focused analysis. It is useful where there is a large amount of data and the chart becomes difficult to read and navigate. For example, a line chart showing sales by date can be quite challenging to interpret; while sometimes the solution may be to reduce the amount of data in the chart (perhaps looking at months instead of days), other times this isn't desirable and you may, instead, want to scroll through to view a particular month's data without losing sight of the overall picture.
The range slider is seen in the visual both in discover and when it is included in a presentation at runtime, but can be enabled and configured in Discover Pro, Present Pro, and when viewing the runtime version of the presentation (on the right-click).
Note: Where the range slider appears depends on the visualization type and configuration in Discover Pro; Line charts, Area charts, and Bar charts may include a horizontal range slider which may be configured to appear above or below the visual; Column charts may include a vertical range slider which may be configured to appear to the left or right of the visual.
Range slider appearance
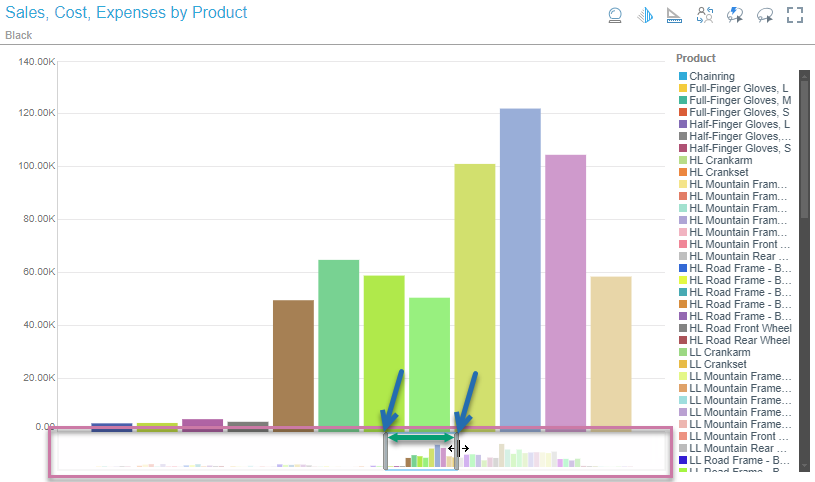
The range slider is visible on a visual when it is included in a presentation at runtime. You can use it to zoom in on a particular section of your Cartesian chart and view its details. In the following case, the range slider is shown below a Column chart (purple highlight) with the visible panel (green) selected using the two handles (blue arrows).
- Click here for more information about the range slider at runtime
Range slider configuration
Show range slider
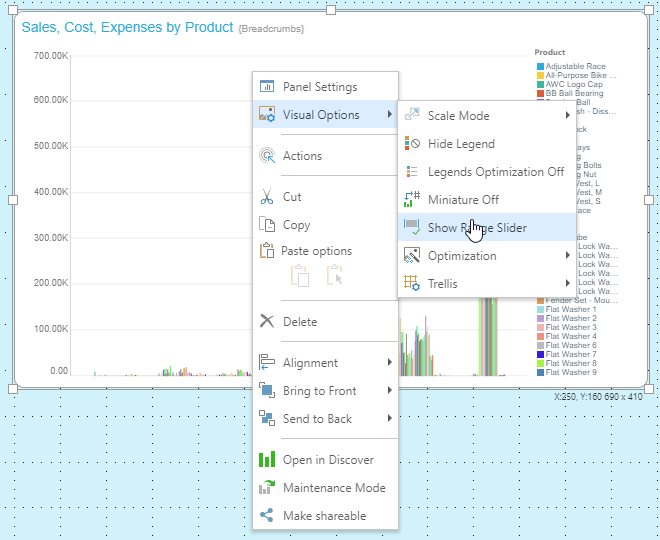
To add the range slider to the visual by default (so the person using the presentation does not have to enable it on their right-click menu), you can select the Range Slider option from the right-click context menu:
- Select the visual on the canvas.
- Right-click the chart background and select Visual Options > Show Range Slider from the context menu.
This adds a dummy range slider to the visual in the appropriate location. In this case, to the bottom of the visual along the x-axis.
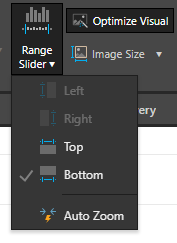
Tip: You can also select whether the range slider is positioned at the top or bottom or left or right of the visual if you configure the range slider using the options on the Component ribbon in Discover Pro.
Hide range slider
To not show the range slider by default:
- Right-click the chart background or the range slider and select Hide Range Slider from the context menu:
Note: Your users will still be able to enable the range slider on the visual in their presentation at runtime. They just won't see it by default.
Discover Pro settings
The range slider settings that are available in Present Pro are a sub-set of the settings available when you open the visual in Discover Pro. If you have access to Discover Pro, you can open the visual in it by right-clicking and selecting Open in Discover from the context menu.
- Click here for more information about the range slider settings in Discover
The right-click options included on the range slider itself set the defaults for the visual:
- Zoom Out: Zoom all the way out to include the entire data range.
- Auto Zoom: Zoom in, letting Pyramid decide the optimal zoom size.
- Turn off Mini-Preview: Remove the mini preview of the chart from the range slider. The range slider itself is still shown, but you are no longer shown an impression of the overall chart as a preview.
- Hide Range Slider: Hide the range slider.
The options from the Component ribbon set the position of the range slider along the X or Y axis:
Note: Which options are enabled depends on the type of Cartesian chart that is selected.