The Pyramid database repository is designed to reflect detailed usage statistics of the platform itself based on logging. The data structures are included in the platform out of the box. However, the usage will not be operational unless logs enabled and stored. This applies to both the 'transactional' logs and the 'slide' logs.
Usage Model, Reports, and Dashboards
As of Pyramid 2023, pre-built semantic model, reports, dashboards and administrative Hub views are included with the installation. They are also added for any versions that are upgraded to 2023 or later.
- The content is stored in the "_Usages" folder in the public domain in the content manager.
- The Hub dashboard is deployed for administrators.
- The model is available for customers and users to adjust as they see fit. And since its presented in Pyramid, its obviously slice-able and dice-able.
For older versions of Pyramid (
General Platform Usage Statistics
The reports in the usage package include
- Client Metrics - details usage by user seat type
- Content Metrics - details of usage by report, dashboard and publication
- Data Source Metrics - details of usage by each data source type, specific databases and data models
- Measure and Attribute Metrics - details of usage by each individual measure and attribute per data model
- User Metrics - details of usage by each user and tenant
- Processing Metrics - details of usage by the Pyramid services that rendered the results
Each metric grouping shows details that include
- Date and Time down to hours, minutes and seconds
- Time metrics down to the millisecond
- Performance Metrics - the detailed breakout of performance times into its sub components
Slice Usage Statistics
As of Pyramid 2025, another package of usage models and reports was added for analyzing dashboard slides. These are presented in a different model and covers these elements:
- Slide Metrics - details of slide usage and time by presentation dashboard, down to the slide level
- User Metrics - details of slide usage by each user and tenant
Transaction Log Settings
The usage model relies on the transactional metadata being captured. This feature needs to be enabled in the admin.
- This data is stored in the database for a limited time which Administrators can change if needed.
- To configure Pyramid to keep the data for a longer period of time, you can change the Keep Transactions Logs setting in the Admin Console under Logs > Log Settings (blue highlight below).
- Before making this change, please make sure the database is capable of storing that much information.
![]()
Slide Logs
Setup for older versions
The following describes how to build a data model using Pyramid's database repository as a data source to be able to analyze content usage and performance in Pyramid itself.
The resulting model will give you insights into:
- WHO: which users and tenants executed query transactions.
- WHEN: the time at which query transactions were executed, down to the hour and minute.
- WHAT: query transactions by data source server and type, database and model, with further details related to content items, the main content folders, and specific hierarchies and measures used in each query (from the "elements" hierarchies).
- WHERE: query transactions by processing server.
- WHICH: query transactions by content type.
And, of course, any combination of the above.
- Flow:
- Start a new advanced data model in Pyramid. Add a relevant data source (PostgreSQL, MS SQL Server, Oracle), depending on which type of repository you have elected to deploy
- From the database listing in the property cards, select the Pyramid database repository
- From the table selection, choose three views
- contentview*
- modelview**
- transactionview
- *Available in 2020.24 and later versions
- **Use the server_log_transaction_columns table instead for versions older than 2020.24
- Click Add Selected Nodes, to add these views to the flow
- Add a new Convert Columns node after the transactionview select node in the flow from the Column Operations side menu
- Change the date column to type "date", with format yyyy-mm-dd
- Add a new In-memory target database node and provide a name for the database ("Pyramid Usage")
- Start a new advanced data model in Pyramid. Add a relevant data source (PostgreSQL, MS SQL Server, Oracle), depending on which type of repository you have elected to deploy
- Model:
- Change the default measure to "Total Time" on the configuration tab
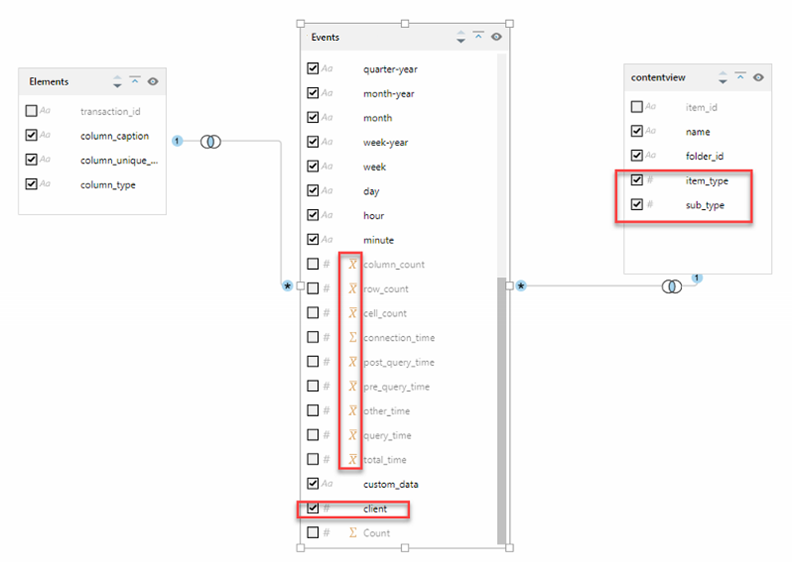
- On the Tables tab:
- Rename the modelview to "Elements"
- Rename the transactionview table to "Events"
- Make sure the Elements table is inner joined to the Events table using the "transaction_id" column
- Make sure the contentview table is inner joined to the Events table using the "item_id" column
- Change the following measures in the Events table to "Average" aggregations: column_count, row_count, cell_count, connection_time, post_query_time, pre_query_time, other_time, query_time, total_time
- Set client as a non-measure and select it
- Right-click on transaction_id column and add a count measure
- Optional: Right-click on user_name and add a distinct count measure (to count unique users)
- Under contentview, set item_type and sub_type as non-measures and select them
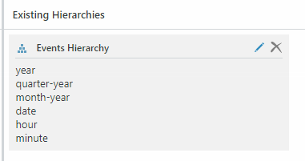
Add a time hierarchy based on Events with year, quarter-year, month-year, date, hour ,minute
- On the Hierarchy tab:
Add a time hierarchy based on Events with year, quarter-year, month-year, date, hour ,minute
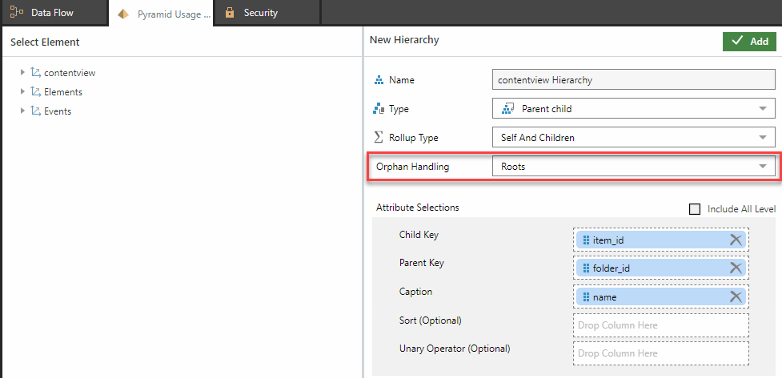
- Add a content tree Parent-child hierarchy with Orphans Handling set to Roots and set the following Attribute Selections:
- Child Key - item_id
- Parent Key - folder_id
- Caption - name
- Save and then Process your model.
The resulting model will take a snapshot of your transactional activity in Pyramid for further analysis.
Set up a schedule on this model to reprocess the database once a day, typically off-peak.
Metrics
Response Size Metrics
- Column Count: The number of RAW columns in the result set
- Row Count: The number of RAW rows in the result set
- Cell count = columns x rows
The RAW result set is not always indicative of the drawn result in the visual.
For instance, matrix grids can be much larger drawn than their underlying RAW results.
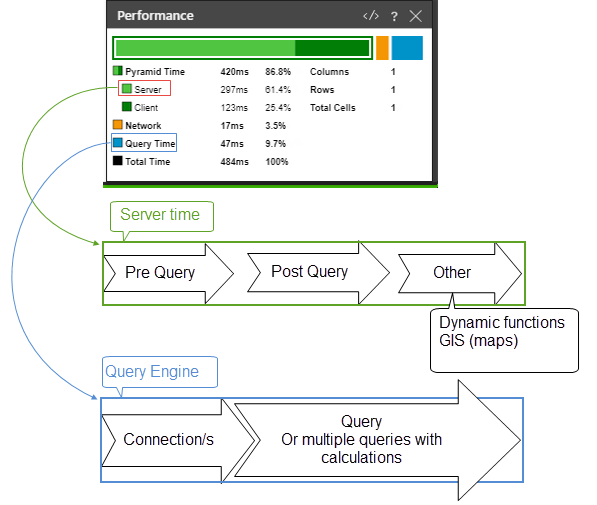
Time Metrics
- Pre-query: Pyramid engine time before the query is submitted.
- Post-query: Pyramid engine time after the query is submitted.
- Other: any time spent on scripting logic and dynamic functions as part of the query
- Server: pre-query + post-query + other + engine - query (not an exact match)
- Connection: the average time taken to connect to the data source
- Query: the time data source takes to respond to the query
- Query Engine: Connection + Queries and Calculations
- Total: server + query engine + network + client
The time aggregates may be slightly off because:
- the measurements are in millisecond integers - so rounding is ignored.
- not every time element is always fully additive - because some items may run in parallel to each other (like 'connection' and 'other' times)
Using these metrics, you should be able to spot performance issues in your query designs vs data source performance vs Pyramid's processing performance.
For further clarification:
- Server time is the entire time that the server handled the request minus the Query Time. That might include queuing time, for example, if the server are receiving more requests than what the services are configured to handle in parallel, or for very big requests there might be an overhead time of creating the payload for the server to send back to the client (browser), and these are not captured by any specific column.
- Connection time is an average time of all the connections that were generated in the request. For simple requests it would probably be an average of 1 item, but there might be multiple. (You can see in the admin view that it is labeled as "average connection"). The connection times are nested inside the Query time, so Connection Time should not be added to Query Time.
- Query Time is only data source related time consumption (connecting, executing, retrieving the data). It is a smart accumulation of all the queries executed against the data source, with consideration of parallel queries.
-
Engine Time is the time that the query was executed including internal processing by Pyramid.