There are four quick style presets supported for Plotted charts. These presets let you apply a pre-designed selection of formatting options to the given chart.
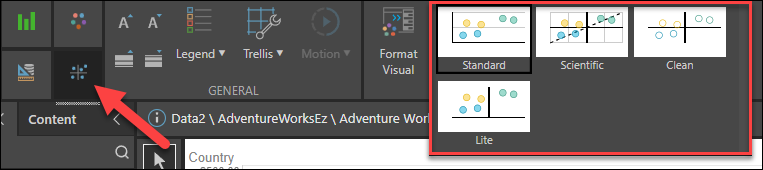
Quick Styles
- Show major Y-axis grid lines.
- Show legend and legend title on the right.
- Show outer axis position (so that the axes intersect at the bottom left).
- Show both X- and Y-axis values.
- Show semi-filled data points.
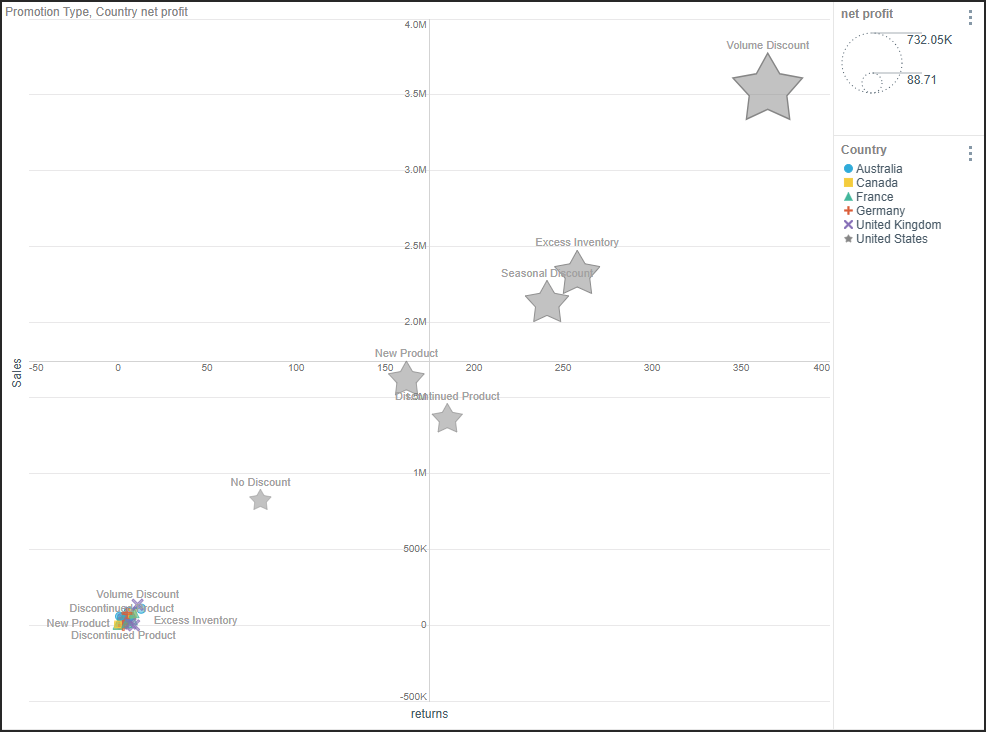
- Show major X- and Y-axis grid lines.
- Show legend and legend title on the right.
- Center the axis position (the axes intersect in the center of the chart).
- Show both X- and Y-axis values.
- Show a zero-based reference line over the chart.
- Show semi-filled data points.
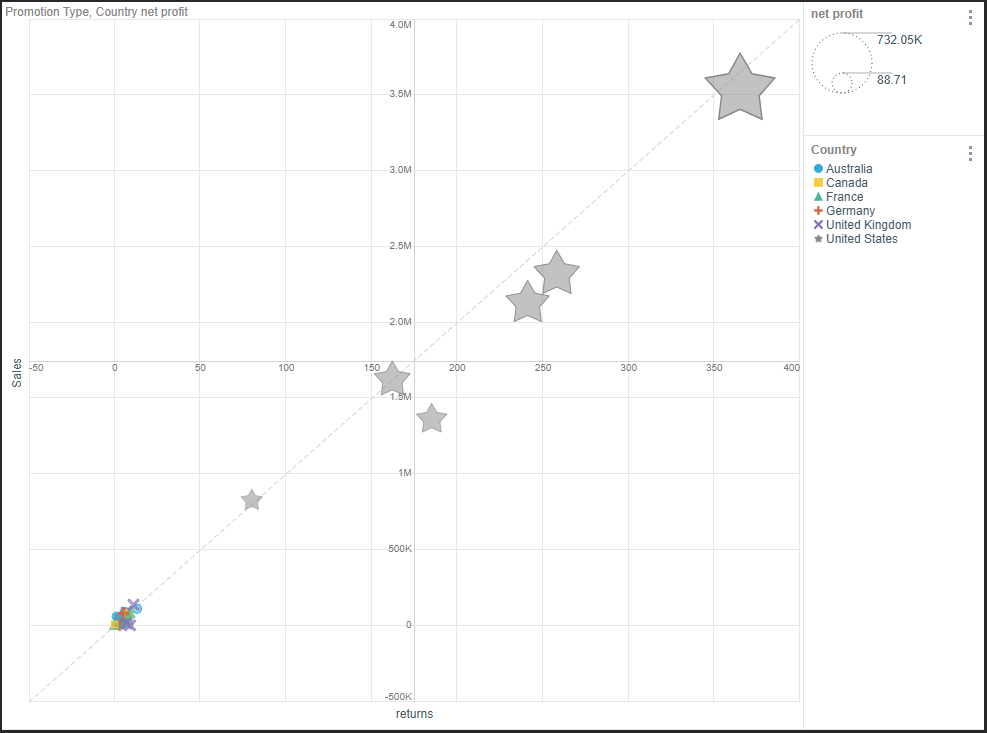
- Hide major X- and Y-axis grid lines.
- Show the legend along the bottom of the chart, without legend title.
- Center the axis position (the axes intersect in the center of the chart).
- Show both X- and Y-axis values.
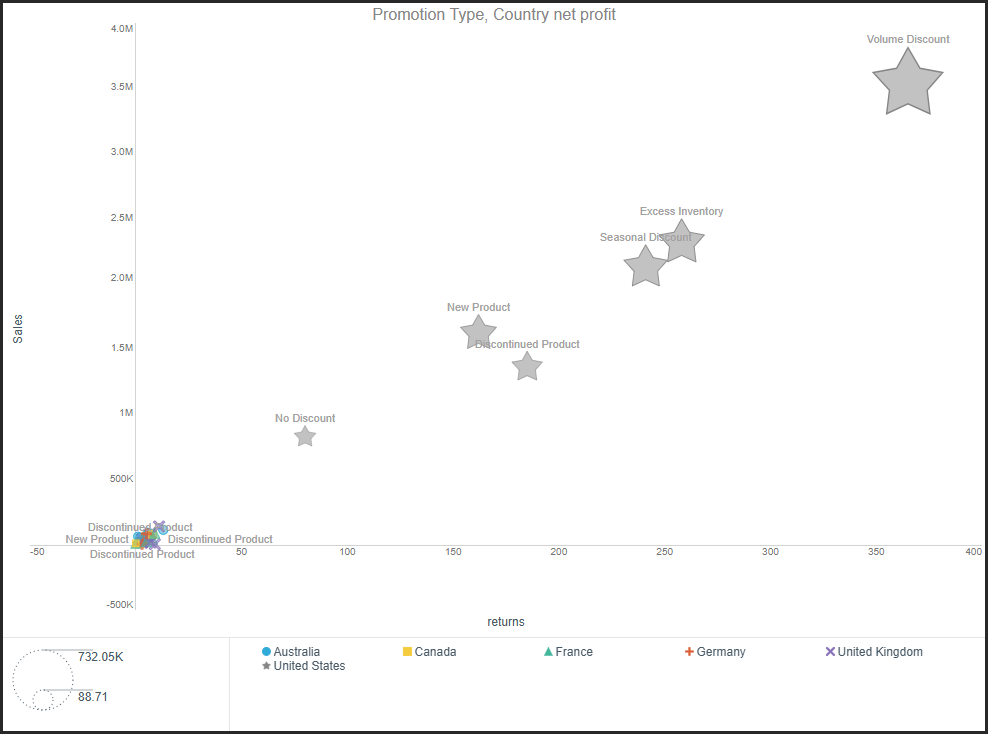
- Enlarge the report title and center it along the top of the chart.
- Show empty data points.
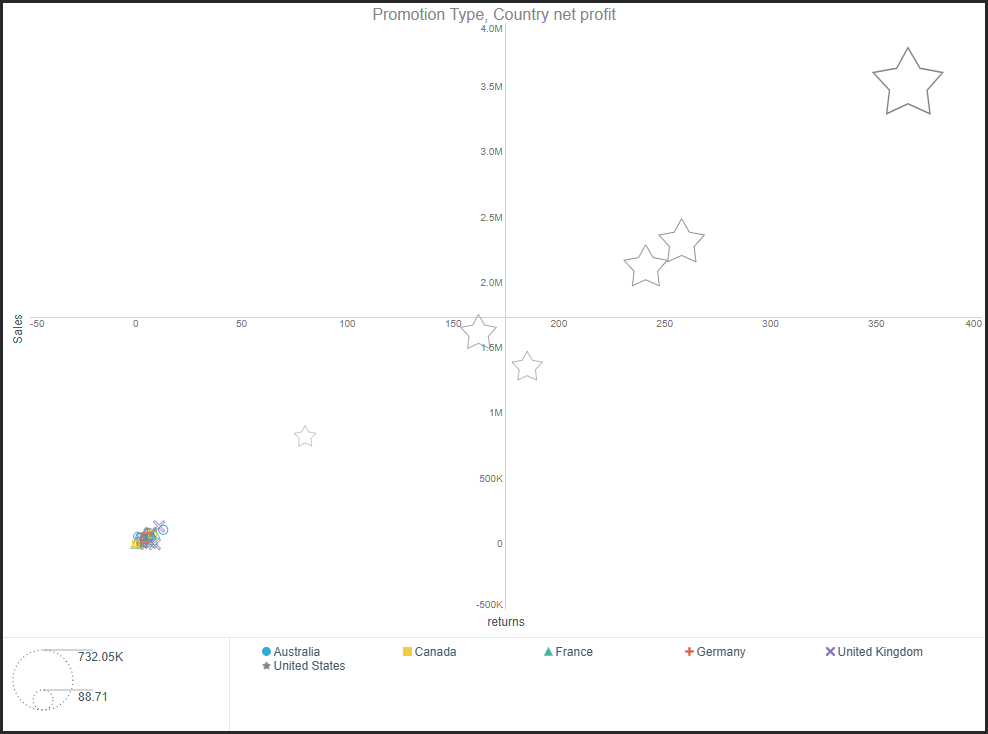
- Hide major X- and Y-axis grid lines.
- Zero axis position (the X-axis will intersect with the 0 point on the Y-axis.
- Show both X- and Y-axis values.
- Enlarge the report title and center it along the top of the chart.
- Show empty data points.
- Show semi-filled data points.