LLM logging provides a list of all queries run by the Chatbot, including requests and responses.
To change the log settings, go to Logs > Log Settings and configure Detailed LLM Logging.
Warning: This data is heavier on the database, so you are advised to only enable LLM Logging if you are currently diagnosing an issue.
LLM Logging
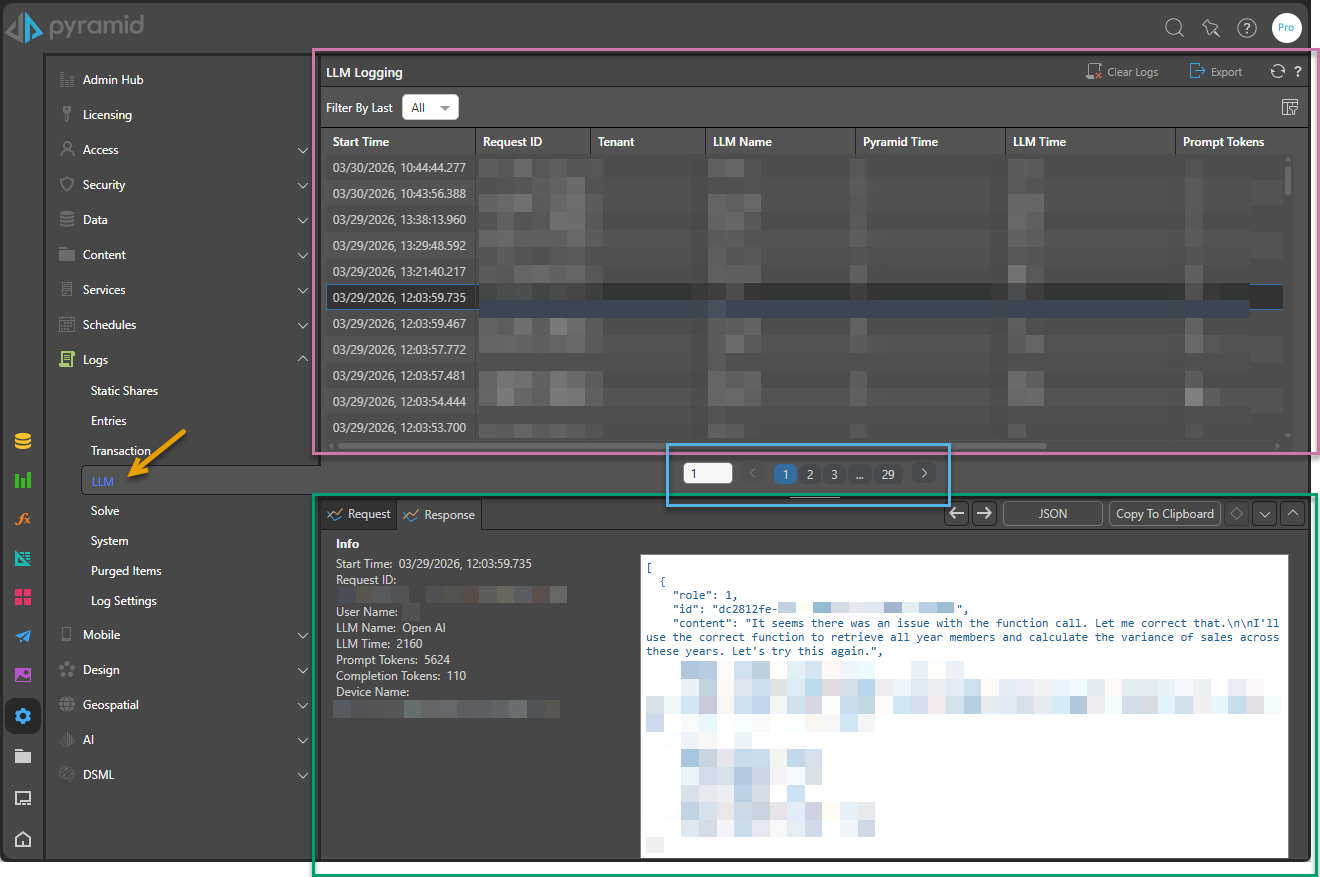
Administrators can view the LLM Logs in the Admin Console from Logs > LLM (orange arrow below):
Log List
The top panel (purple highlight above) shows the list of all logged LLM queries. This panel occupies the full page unless a row is selected. Selecting a row in the list causes the Log Details panel at the bottom of the page to open and reduces the available space.
Note: If this page is empty, there are no logs to display. This could be because your filter excludes available logs, because logs were recently purged, or because LLM logging is not enabled in the Log Settings page.
Filter By Last
Include only those events that were logged within a selected time period:
- Select a <time period> to include events logged between now and that selected time (between 1 minute and 12 months ago).
- Select All to include events logged at any time.
- Select Custom to include events logged within a custom period. From Date and To Date fields appear, letting you supply the details of your custom time period.

Clear Logs
Click Clear Logs to purge all LLM logs; that is, to permanently delete them.
Export
Click Export to download a CSV file detailing all displayed logs.
Column View
Click Column View (orange arrow below) to select which columns should be shown in the Log List:
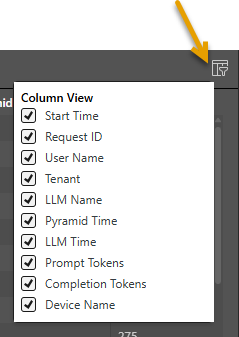
The Columns that can be shown or hidden for each event are as follows:
- Start Time: The start time for the query.
- Request ID: The unique identifier for the request.
- User Name: The name of the user who submitted the query.
- Tenant: The name of the tenant.
- LLM Name: The name of the LLM that processed the query.
- Pyramid Time: The time spent before and after submitting the query in Pyramid's own processes.
- LLM Time: The time taken by the LLM to respond to the request and provide results.
- Prompt Tokens: Tokens sent to the LLM.
- Completion Tokens: Tokens received by Pyramid from the LLM.
- Device Name: The name of the device that submitted the query.
Header options (Sort and Filter)
Most column headers include options to sort and filter the results, which are shown when you hover your cursor over the header panel:
- Sort: Orders the results by ascending or descending order.
- Filter: Limit the results shown in the column by value. Click the filter icon associated with your column, specify the details of your filter, and click Apply. Which details you see depends on the data type of the value in the selected column.
Pagination
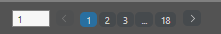
Where there are more results than fit on a single page, a set of pagination controls opens underneath the table of results. You can use these controls to:
- See how many pages of results there are.
- Move between the pages of results.
- Go directly to a specific page of results.
Log Details
Click a row in the top panel to open the details of that query in the bottom panel. The bottom panel is broken into two sections, Request and Response, which you access using the tabs to the left of the panel:
- Request: The request sent to the LLM.
- Response: The response returned from the LLM.
The Info column displays detailed information about the request or response. The details are a subset of the Columns (described above).
The Main window displays the full Request or Response.
Previous and Next
You can use the Back and Next arrows at the top of the Log Details panel to move onto the next query or to return to the last query in the Log List.
JSON
Click JSON to "pretty print" any JSON text in the response. This improves the readability and structure of the displayed response.
Copy to Clipboard
Copy the content of the panel, in full, to your clipboard.