Solve Transaction logging provides a list of all of the occasions on which Solve algorithms have been run in the application, within a given time period. You might want to investigate your Solve logs if you are investigating the performance of your system, perhaps your methods are taking too long to run and could be reconfigured, or perhaps they are run too frequently and you could improve performance by changing their Auto Run settings.
Solve logging is enabled by default. To change the log settings, go to Logs > Log Settings.
- For more information about Solve, see Solve Overview.
Solve Log Details
The solve log page is broken into two panels.
Top Panel
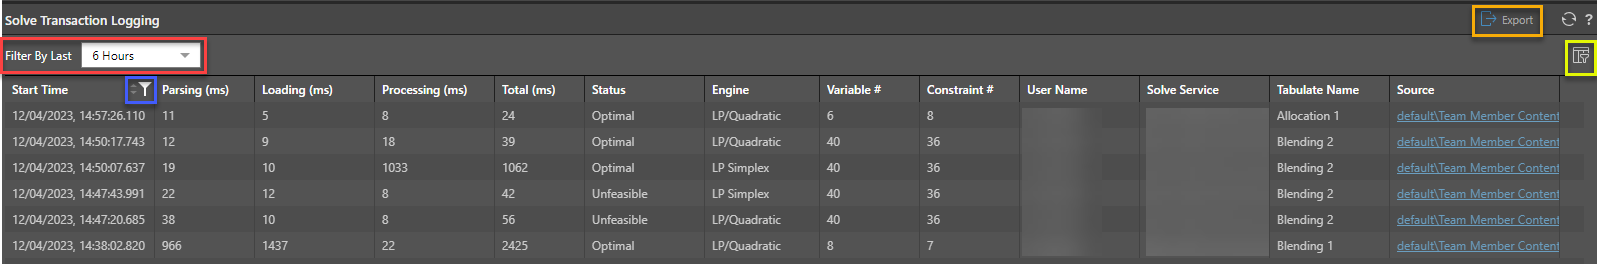
Filter by Last
Include only those events that were logged within a selected time period (red box, above)
- Select a time period to include events logged between now and that selected time (between 1 minute and 12 months ago).
- Select All to include events logged at any time.
- Select custom to include events within a custom period. Start and End Date fields let you supply the details of your custom time period.
Start Time Filter
The Start Time Filter (blue box above) allows users to show rows equal to, before, after, or between selected date and time values
Export
Selecting the export button will download a CSV file detailing all the solve logs displayed.
Displayed Columns
The panel displays high level stats on the time details of the solve transaction.
- Start Time: the start time of the query.
- Parsing: the time spent parsing the solve query in milliseconds.
- Loading: the total time needed to load the query in milliseconds.
- Processing: the time it took for the data source to execute and return the query in milliseconds.
- Total: the total time it took in milliseconds.
Additional columns display details of the transaction
- Status
- Engine
- Variable #
- Constraint #
- User Name
- Solve Service
- Tabulate Name
- Source
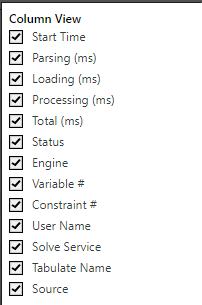
Column View
The Column View (yellow box above) enables users to select the required columns to be displayed
Sort and Filter
Most column headers include options to sort and filter the results:
- Hover over a column header to Sort the results by ascending or descending order.
- Hover over a column heading to open the Filter options. Filtering allows you to limit the results shown in the column by value. Click the filter icon associated with your column, specify the details of your filter, and click Apply. Which details you see depends on the data type of the value in the selected column:
- If the column contains a Date / time you can select from the options:
- Equals - Return logs with the selected date and time.
- Before - Return logs up to the selected date and time.
- After - Return logs after the selected date and time.
- Between - Return logs within a particular date and time window. In this case, you need to specify the start and end date for your filter.
- If the column contains a Number you can select from the options: Equals, Not Equals, Greater than, Greater than or Equals, Less than, Less than or equals, and specify a comparison value.
- If the column contains a String you can select from the options: Equals, Does Not Equal, Start with, End with, Contain, Does not contain, and specify a comparison value.
Pagination
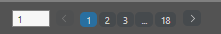
Where there are more results than fit on a single page, a set of pagination controls opens underneath the table of results. You can use these controls to:
- See how many pages of results there are.
- Move between the pages of results.
- Go directly to a specific page of results.
Bottom Panel
The bottom panel is broken into two sections:
- Info - basic transactional details (red box).
- Model section (blue box), showing the Solve method as a JSON string.
Click on a row in the top-panel to open the bottom panel.
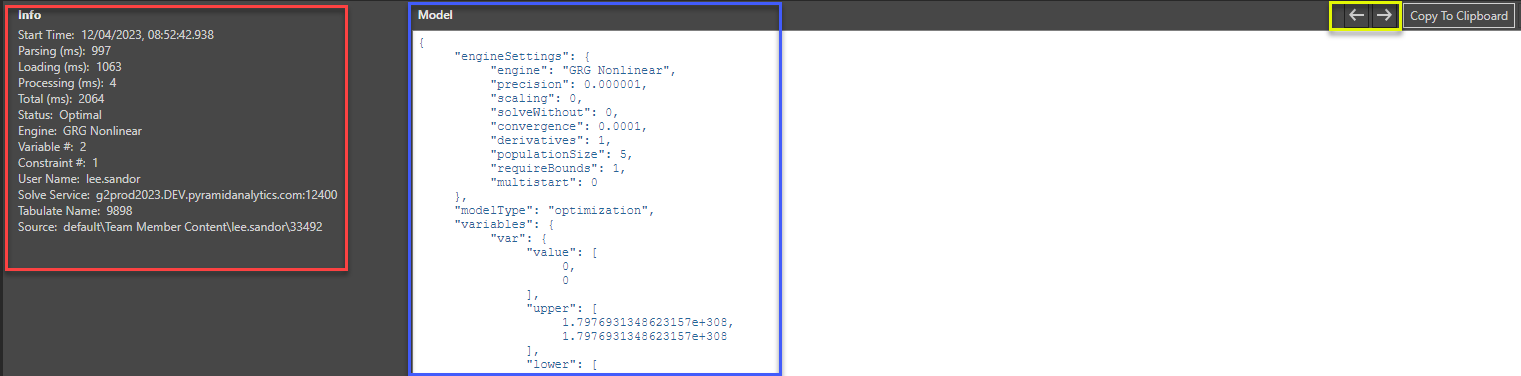
Previous and Next Log
Users can traverse to view the details of the previous or next log by clicking on the previous and next buttons (yellow box)