The system log is designed to capture events for review and analysis by system administrators when resolving issues.
- The top panel lists system log events.
- The bottom panel, which opens when you double-click a row in the top panel, shows the message associated with the event.
By default, the System Logging page shows all logged events from the last 15 minutes with a log level of 0 (the highest level). To change the system log settings, go to Logs > Log Settings.
Warning: Setting the system logging to a different level of detail (like debug or trace) can severely impact the platform's performance. It should only be changed temporarily for diagnostic purposes.
System logging
From the Admin Console:
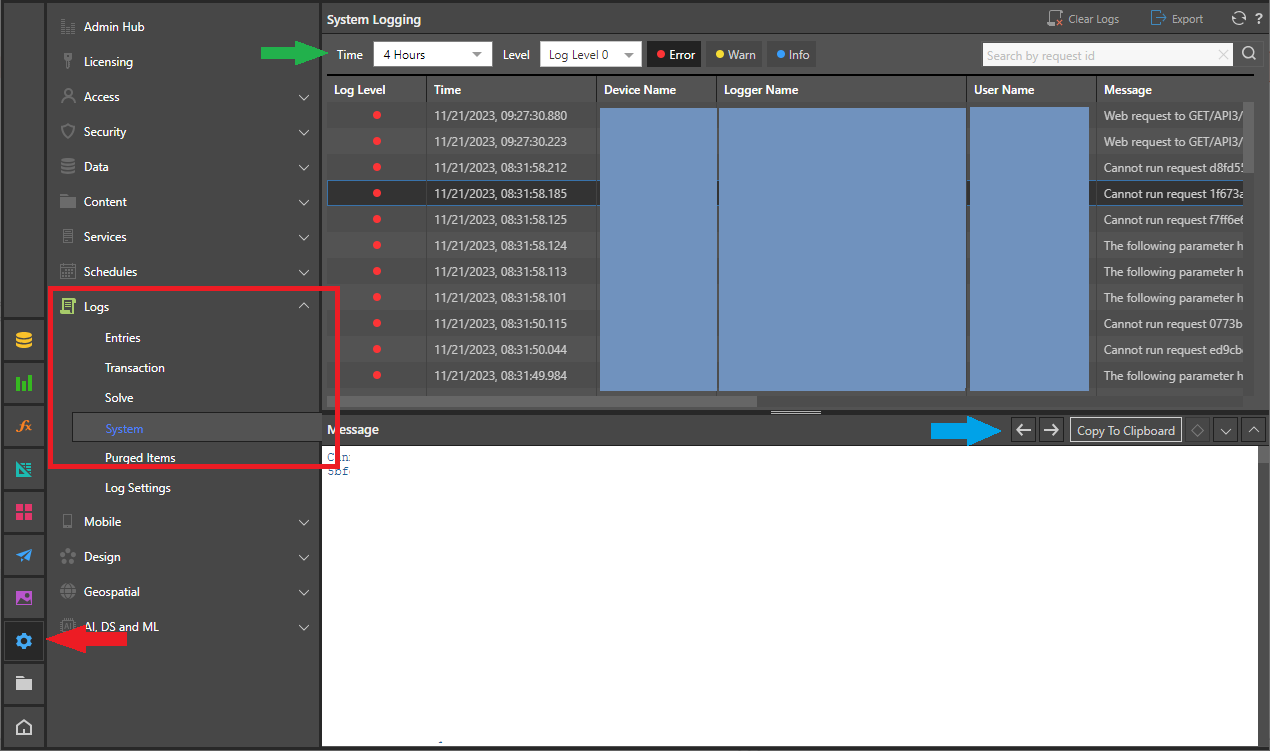
- In the left-hand menu, click Logs > System (red).
- Optionally, change which logs you can see by updating your filters (green).
- Double-click a row in the top panel to open the message associated with that logged event in the bottom panel.
The System Logging page opens. Note: If there are lots of results, they are split across a few pages. You can move between these pages using the pagination links.
For details of the available filters, see Filters.
Page reference
Page controls
- Clear Logs: Click Clear Logs to "purge" (permanently delete) all of the logs of this type.
- Export: Download the log as a CSV file. The exported file contains all logged events matching your currently selected filter criteria.
- Refresh: Refresh the page with the latest data. Note: The view is also refreshed whenever you open this page or change your filter criteria.
- Help (question mark): Open the online Help.
Top panel
Filters (green)
Time
Include only those events that were logged within a selected time period:
- Select a <time period> to include events logged between now and that selected time (between 1 minute and 12 months ago).
- Select All to include events logged at any time.
- Select Custom to include events logged within a custom period. From Date and To Date fields appear, letting you supply the details of your custom time period.
Level
Include events that have been logged with a particular severity level. The severity level is numbered, with the highest severity event having the lowest numeric value (level 0).
The severity level is numbered, with the highest severity event having the lowest numeric value (level 0):
- Log Level 0 (default) - The highest-level events. Important runtime errors or unexpected conditions. Note: Events at this level are further subdivided into Errors, Warnings, and Info.
- Log Level 1 - Undesirable or unexpected events that are not necessarily errors. For example, may indicate use of deprecated APIs, poor use of an API, and "almost" errors.
- Log Level 2 - Interesting runtime events. For example, logging start up or shut down events.
- Log Level 3 (Debug) - Detailed information on the flow through the system. Debug events are rarely required.
- Log Level 4 (Trace) - The lowest level events. Trace events are rarely required.
Selecting a severity level returns events at that level and events with any higher severity level. For example, selecting Log level 2 shows events at levels 2, 1, and 0.
Note: You can select any of the possible levels but will only see events if logs are being or were collected at that level. Which logs are collected is controlled in your Log Settings.
Level 0 Filters
If you are viewing events with log level 0 (the highest level), you can further subdivide your events by selecting one or more of the Error, Warn, and Info buttons:
- Select Error to show events relating to system errors.
- Select Warn to show events relating to application errors.
- Select Info to show events that provide information about the progress of the application.
Search
Paste in a full Request ID to return details of any events associated with that request. When a request ID is supplied, any other filter settings are ignored.
Table of results
The top panel shows a summary of all the system log events as a table of results, filtered by your current selections. By default, the table of results is sorted by time, with the most recent events at the top.
Log level
In the Log level field, the value can be one of the following:
- A number between 1 and 4. The severity level, from the second highest severity (1) to the lowest severity (4 - trace).
- If you are viewing events with the highest severity level (level 0), an "indicator". The indicator reflects the "type" of level 0 event it is: Error, Warn, or Info. For more information, see Level 0 filters (above).
Tip: You can hover your cursor over the colored indicator to see the type of event it is as a tooltip.
Sort
Hover over a column header to Sort the results by ascending or descending order.
- If you have log level 0 selected and sort on the log level column, the events are put into Error > Warn > Info order or the inverse, depending on ascending or descending selection.
- If you have a log level greater than 0 selected and sort on the log level column, the events are sorted by numeric level and the Error > Warn > Info classification is ignored. This means that the events that share log level 0 appear at the top or bottom of the list (depending on the Sort direction) but will be ordered by time within that.
Filter Results Columns
Hover over a column heading to open the Filter options. Filtering allows you to limit the results shown in the column by value. Click the filter icon associated with your column, specify the details of your filter, and click Apply. Which details you see depends on the data type of the value in the selected column:
- If the column contains a Date / time you can select from the options:
- Equals - Return logs with the selected date and time.
- Before - Return logs up to the selected date and time.
- After - Return logs after the selected date and time.
- Between - Return logs within a particular date and time window. In this case, you need to specify the start and end date for your filter.
- If the column contains a Number you can select from the options: Equals, Not Equals, Greater than, Greater than or Equals, Less than, Less than or equals, and specify a comparison value.
- If the column contains a String you can select from the options: Equals, Does Not Equal, Start with, End with, Contain, Does not contain, and specify a comparison value.
Note: Log level does not have a Filter option in its header.
Pagination
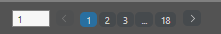
Where there are more results than fit on a single page, a set of pagination controls opens underneath the table of results. You can use these controls to:
- See how many pages of results there are.
- Move between the pages of results.
- Go directly to a specific page of results.
Bottom Panel
The bottom panel is broken into two sections:
- Info - basic transactional details (red box).
- Error message section (blue box).
Click on a row in the top-panel to open the bottom panel.
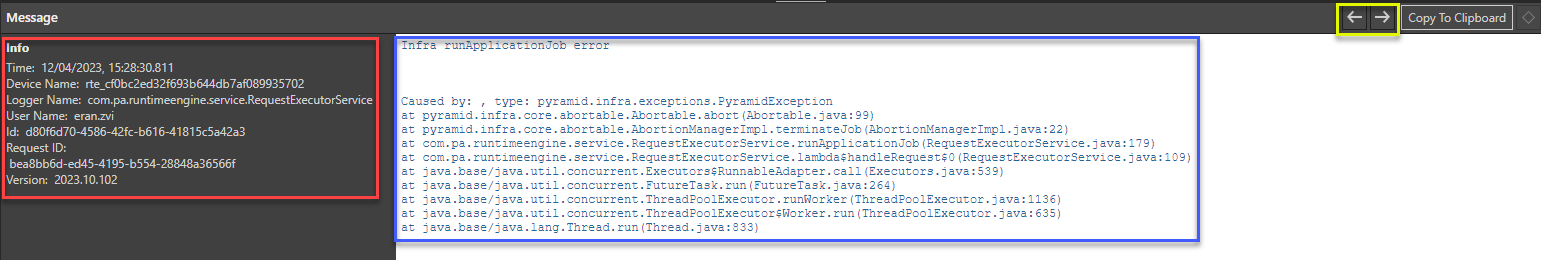
The options above the panel include:
- Backward / Forward Arrows: Click an arrow to move between the messages in your current result set.
- Copy to clipboard: Copy the content of the panel, in full, to your clipboard.
- Restore (diamond): Restore the bottom panel to its previous state.
- Minimize: Hide the panel temporarily.
- Maximize: Increase the size of the panel to fill all available space.