Basic users experience all Pyramid's core functionality for all their Pyramid content embedded in third-party web applications. Pyramid allows you to perform interactive query functions directly from the right-click context menu for queries. The various query functions allow you to change the way a query resolves a data set result and its related visual. Embedded users also have access to built-in presentation menus and panel tools for presentations.
Context Menus
Right-click the cells, columns, headers, legends, or segments of a visual to access its interactive query functions. The pop-up menu differs depending on whether a member or value is selected:
Functions
- Drill Down, Drill Up, and Drill to Level - Drill functions allow users to move between different levels of a user hierarchy.
- Expand and Collapse - Expand and Collapse allows users to hide and show multiple levels of the hierarchy in a grid visualization.
- Dice, Add, Swap, and Remove - Dicing allow users to 'drill across' from a chosen element into another hierarchy. The Add, Swap, and Remove menus offer variations of Dice, to inject and replace hierarchies.
- Member and Data Point Selection - Selection tools allow users to easily and intuitively select elements and data points for analysis directly from visualizations.
- Quick Sort - Sorting allows the user to choose the order in which data and items are presented in a visualization. You can also open the Quick Sort Wizard from the Quick Sort menu or root.
- Quick Filter - Filtering allows the user to numerically filter data and items in queries.
- Pivot - Pivot allows the user to rotate selections between drop zones in your query design.
Extended Operations
- Copy - Copy the data point or data in a grid to the clipboard so it can be pasted into a spreadsheet or document.
- Actions - Launch actions that have been configured.
- Chat - Launch the Chatbot and interact with your Embedded Visual.
Content Details
- Rate item - Provide a rating out of five for the content item.
- OData - Copy a URL or snippet to your clipboard that allows results to be read into another client's technology.
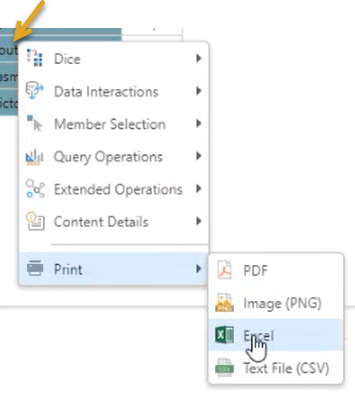
- Printing is limited. You can print either an entire presentation or the current slide to PDF or Excel. You can also print individual visuals to Excel, CSV, PNG, or PDF (with single or multi-page options).
Presentation Menu
Access the presentation menu from the hamburger menu in the upper left-hand corner of the slide when viewing the embedded presentation:
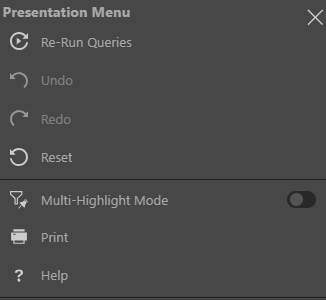
- Re-Run Queries: Re-run the queries in the visuals.
- Bookmarks: Select a bookmark from the dropdown list to reset your slicer selections to saved values. This saves you the time that you may have spent manually changing each of your slicers.
- Multi-Highlight Mode: Enable cross-highlighting of visuals by multiple member elements or data points.
- Help: Go to the user help.
Note: Bookmarks are available where users log on using their named account. This will only be operational when using the Named Embedding license option.
Panel Tools
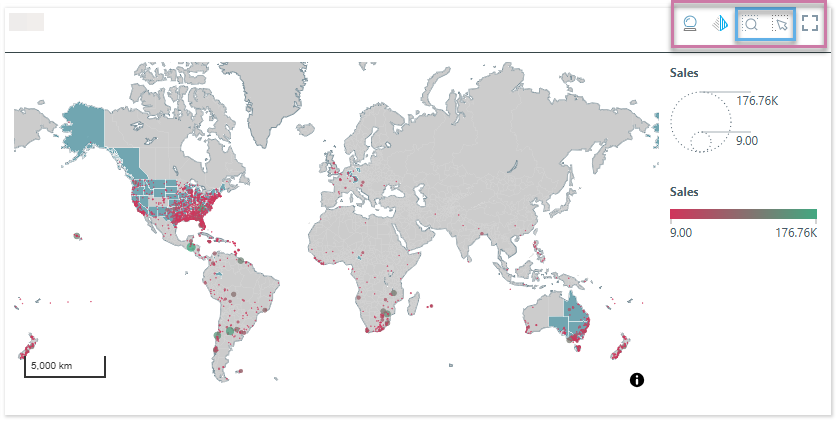
Note: The preceding shows the panel tools (purple highlight) for a Map visual. For this visualization type, the configurable Lasso and Zoom tools (blue highlight) are typically available.
Core Panel Tools
- Smart Insights: Click the crystal ball to produce an AI-driven analysis of the current visual, with the output returned in natural language.
- Chatbot: Click the pyramid icon to open the Chatbot and interact with visualizations in an intuitive way using natural language.
- Full-Screen: Click the full-screen icon to open up the specified visual to fill your available screen. You can close the full screen visual by clicking Esc or the panel tool in the top-right.
Lasso and Zoom Tools
Configurable Lasso Tools

For Maps, most Charts, and Grids the lasso tools are as follows:
- Zoom Lasso: (Not available for Scatter Plots, Segment Charts, or Grids.) Draw a shape on your canvas to grab multiple items at once, zoom in on those items, and perform your configured Action (typically, this is Select).
- Select Lasso: Draw a shape on your canvas to grab multiple items at once and then perform your configured Action.
Set Configuration
Unlike the other panel tools, both of the Zoom Tools allow you to select configurations before you use them. The configuration panel is opened by right-clicking the panel tool button (orange arrow below) and selecting Actions and Shapes that you want to use from the menu therein:
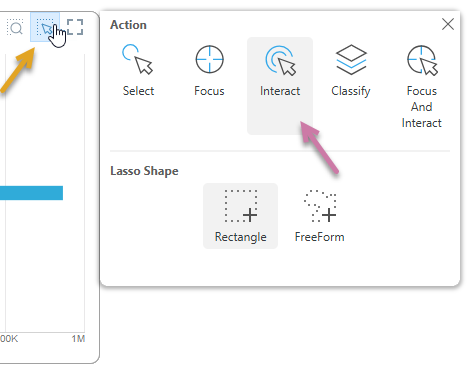
Actions
When you grab contiguous items using one of the lassos, you can perform one of the following Lasso Actions on them all:
- Select: Select the items inside your lassoed area. Once selected, you can access actions that are applicable to your selections on the right-click context menu.
- Focus: Filter the data points to keep those that are inside your selected area. This makes your view less "noisy."
- Interact: Interact as soon as the selection is made; for example, cross-filter the target visuals without clicking Interaction on the context menu.
- Classify: Classify your selected data points as being "in" a group and any other data points (those that are not selected) as being "out" of that same group.
- Focus and Interact: Filter the data points to keep those that are inside your selected area and run the Interact action right away.
Shapes
When you select contiguous items using one of the lassos, you can choose to use one of the following Lasso Shapes:
- Rectangle: When you drag your lasso across the items, you draw a rectangle shape. Everything inside the rectangle is selected.
- Circle: When you drag your lasso across the items, you draw a circle starting at its center and moving outwards. Everything inside the circle is selected.
- FreeForm: Draw a shape "free hand" that selects your data points. You do not need to draw a "closed loop," you simply click and, holding your mouse button, draw the shape or line. Your action finishes when you release your mouse button. Anything that the line intersects and any area that would be filled if you joined your first and last points, as indicated by the shaded area, is selected.
Simple Lasso Tools
For gauge charts, where the configuration options are not available:
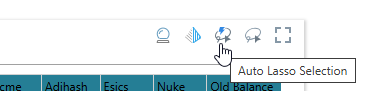
- Auto Lasso Tool: Use the dynamic lasso selection tool if cross-filters for your visuals have been configured. The affected visuals will be filtered by the selected data points.
- Lasso Selection Tool: Use this tool to select multiple data points and then interact with them.
Related Topics
- Query Interactions in Discover
- Presentation Menu in Present at Runtime