Context, "Report" or "Window" functions allow users to build calculations that can ONLY be resolved efficiently in the context of a report or are BEST to resolve in such a context. As such, context calculations effectively expose solutions to two forms of analytical problem types:
- Cross-selection or Cross-axis Queries: Often a calculation's logic can only be resolved by taking into account the other selections made in the query. While this can be solved using classic analytical functions ('semantic calculations'), it tends to be very inefficient, since the calculation needs to be constantly redefined manually each time the cross-selection is changed. Context calculations make these types of analyses ultra efficient, by automatically changing their mechanics based on the changing cross-selection without the need to redefine them each time. This is different from other calculations and business logic, which are designed more agnostically and in the context of the overall data model without regard to a specific usage.
- Advanced Analytics: Advanced query functions often employ statistical techniques with machine learning algorithms that allow the user to apply logic to results that produce deeper insights - going well beyond the basic data query. Since these advanced techniques are typically built with Python, R, SAS or in-built code that sit on top of the query result set, and are often processed by taking into account the context of the query (much like the cross-axis logic above).
Separately, a third type of analytical problem - categorization - is also solved with custom calculations. However, they generate "custom columns" calculations instead. See here for more.
Adding a Context Calculation
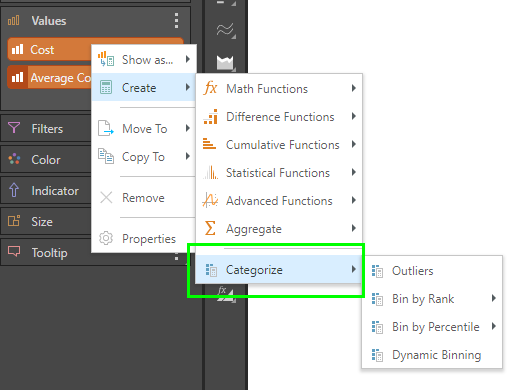
Context calculations are primarily added via the right-click context menu in Discover:
- Hierarchies (blue chips): Choose 'Create' from the drop zone context menu and select the relevant operation.
- Measures (orange chips), users can choose from the following options:
- Show As: Replace the given value with the calculated value. This option is only available for measures.
- Create: Add the calculated value or dimension, alongside the existing value or dimension.
Context calculations will be displayed in the Measures or Dimensions panel, and can then be removed or added to the drop zones as required.
Depending on the calculation selected, a custom column or measure will be generated. Categorize functions generate custom columns that appear in the Dimensions panel, under Custom Columns. Other calculations generate custom measures that will appear below the Measures panel.
Note: Almost all the advanced analytic options can also be created (and edited) through the advanced analytic function wizards described here.
Adjusting Context Calculation Logic
As well as editing and changing the properties of a context calculation, such as its name or format, it is possible to alter the logic of how the calculation is performed using the value chip placement (see below) and the Context Calculation Logic Editor.
Values Chip Placement
The placement of the orange "Values" chip in the drop zones will impact the way the context calculations are resolved.
- If there is only 1 value or measure chosen (so no Values chip), the calculation will apply to the entire query, cell by cell.
- If there are 2 or more values, or if the Values chip is placed on a positional drop zone (like rows or columns), the calculations will be determined in the context of the placement. So if placed on columns in a grid, the logic will flow down rows. If placed on rows, the logic will flow across columns.
- To see examples of the chip placement effect, see cumulative calculations.
Context Calculation Types
There are various types of context calculations - covering measures, non-measures (or categories) and quick calcs.
Context Measure Calcs
These context calculations are effected by creating new measure values (orange chips). In almost every case, the measure's operation is affected by the hierarchical selections made in the other axes (or drop zones).
Cross-axis
All cross-axis calculations work off a single measure at a time only. However, it is possible to build multiple cross-axis calc's on multiple measure and visualize them concurrently.
Difference Functions
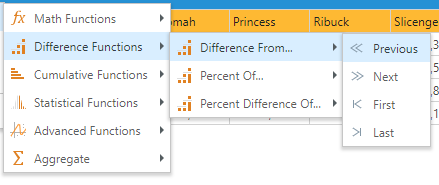
- Difference from: Subtracts each data point from the previous, next, first or last data points, and displays the difference.
- Percent of: Calculates each data point as a percentage of the previous, next, first or last data point and displays the percentage.
- Percent of Difference of: Calculates the difference of each data point to the previous, next, first or last data point and displays the difference as a percentage.
- Click here for more on Difference calculations and examples.
Cumulative Functions
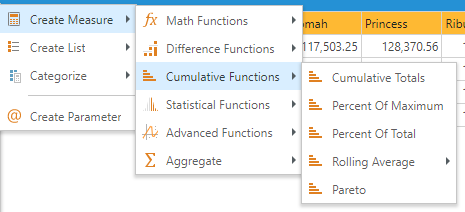
- Cumulative Totals: Adds each data point to the previous one to display a running total.
- Percent of Total: Calculates the total value of the given data points and displays each individual data point as a percentage of this total value.
- Percent of Maximum: Finds the data point with the maximum value, which is given a value of 100%. The value of all the other data points are calculated and displayed as a percent of the highest value.
- Rolling Average: Calculates the average across the current data points and the previous "n" data points.
- Pareto: Uses the Pareto principle to show each items accumulating percentage (and combination of cumulative totals and percent). It is useful in understanding causes of a problem, and then identifying where the largest improvement can be made with the smallest effort.
- Click here for more on Cumulative calculations and examples.
Statistics
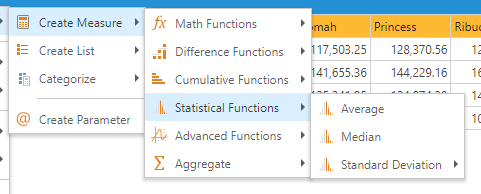
- Average: Calculates the average for the given metric across the elements in the result set. This is useful for plotting average line in a chart to highlight the comparison to the average.
- Median: Finds the median for the given metric across the elements in the result set. This is useful for plotting median line in a chart to highlight the comparison to the median.
- Standard Deviation: Calculates the standard deviation for the given metric across the elements in the result set. This is useful for plotting standard deviation lines in a chart to highlight the comparison to the standard deviation.
- Click here for more on Statistic calculations and examples.
Advanced Analytics
Advanced analytic functions can work off one ore more measures - and use the data in the result set to drive their logic. The context functions represent the "quick" versions of the advanced analytic functions found in the Discover query ribbon.
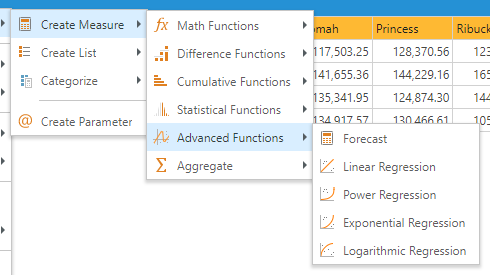
Forecasting
Forecasting: Forecasts work off a single measure at a time only. However, it's possible to build multiple forecast calc's on multiple measure and visualize them concurrently. The context menu forecast uses the "best fit" option by default - and offers a quick way to build and add a forecast to the query. Click here for more granular control of forecasting.
Regression Models
All regressional calculations can work off one or MORE measures - based on what is contextually included in the query result. The context menu regressions use offer a quick way to build and add a regression to the query. Click here for more granular control of regressions.
- Linear: Calculates the linear regression (using a linear equation).
- Power: Calculates the linear regression (using a power equation).
- Exponential: Calculates the linear regression (using an exponential equation).
- Logarithmic: Calculates the linear regression (using a logarithmic equation).
- Click here for more on Advanced Analytic calculations and examples.
Non-contextual Quick Calculations
As described in the overview, there are other types of non-contextual calculations like quick formulas, quick lists, quick parameters and custom columns. While these calculations are driven off the same context menu graphically, their purpose and logical function is subtly different to context calc's.
- Click here for a short overview of the calculation types and engines.
- Click here for an in-depth review of the different Pyramid calculation engines.
Category Context Calculations
A special type of context calculation group, known as "categorization", is driven based on the context of the existing query and its selections. However, it generates a custom column in the background.
These calculations are explained further in the "custom column" section and cover the logic for both categorization of measure values and hierarchical values.
Managing Context Calculations
The process of creating and using Context Calculations is specifically designed to make general assumptions about the logic, naming and presentation of the item to keep the exercise as fast and as simple as possible for users. Context Calculations are also delivered as one-off logic elements since they are always specific to a report or visualization. However, they can be lightly edited and deleted.
- Click here for more detail on each of these capabilities.