Pivoting allows the user to auto-switch around the positions of hierarchy or value chips in two drop zones. In effect, it's an attempt to pivot the visual logically, potentially showing the data in a more interesting way or highlighting relationships in the data and seeing them in a different light. More simplistically, Pivoting allows the user to make better use of screen real-estate, potentially laying out the visual in a more efficient manner by moving certain elements around.
Using the Pivot Operation
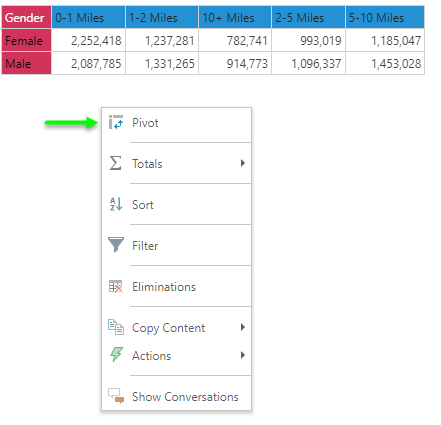
Pivoting is accessible through the right click content menu as well as through the buttons on the Discover home and query ribbons. There is no dialog for the effect, so they are all identical in function and purpose.
Ribbons
Home Ribbon

Query Ribbon

Context Menu
Pivot Behaviors
The Pivot function changes its behavior depending on the visual being used.
Note: There is no logical way of pivoting data in a mapping visual - so the feature is disabled.
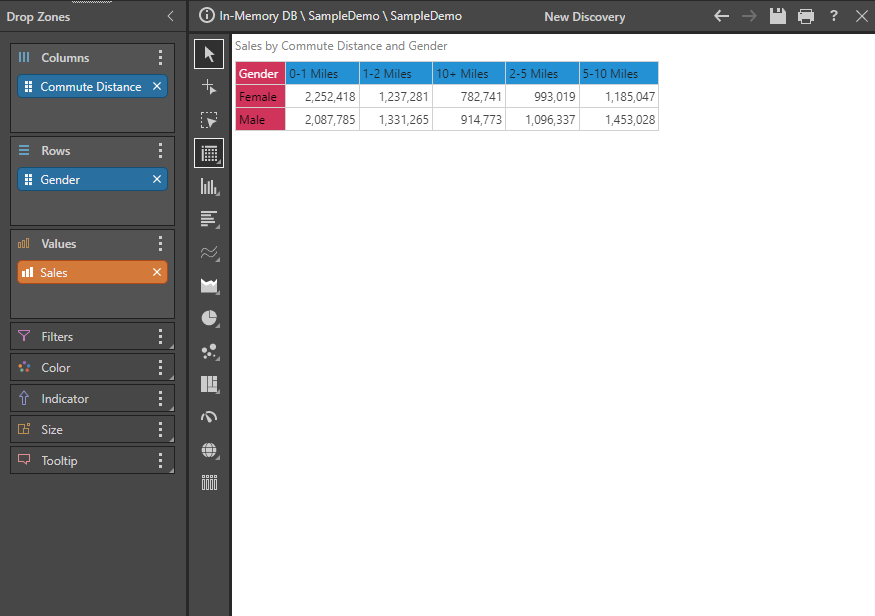
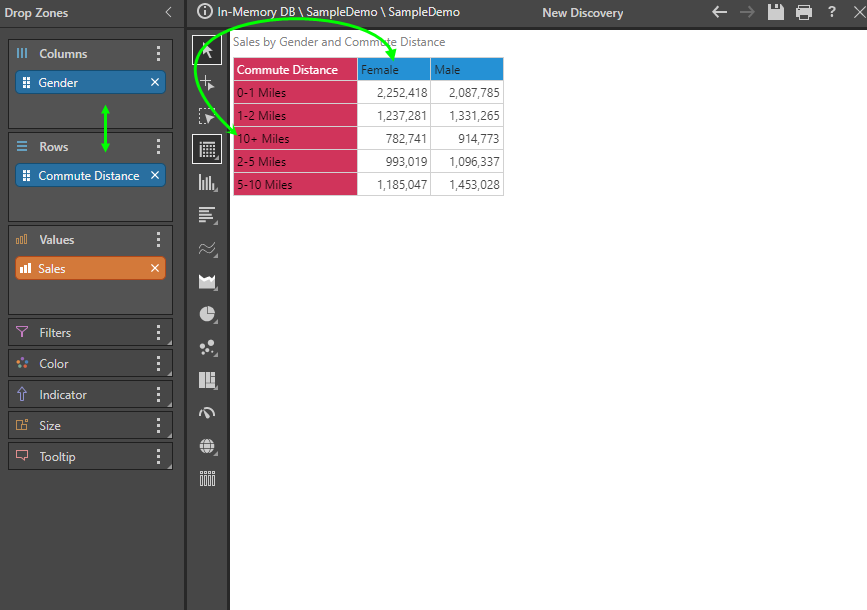
The column and row drop zones are swapped.
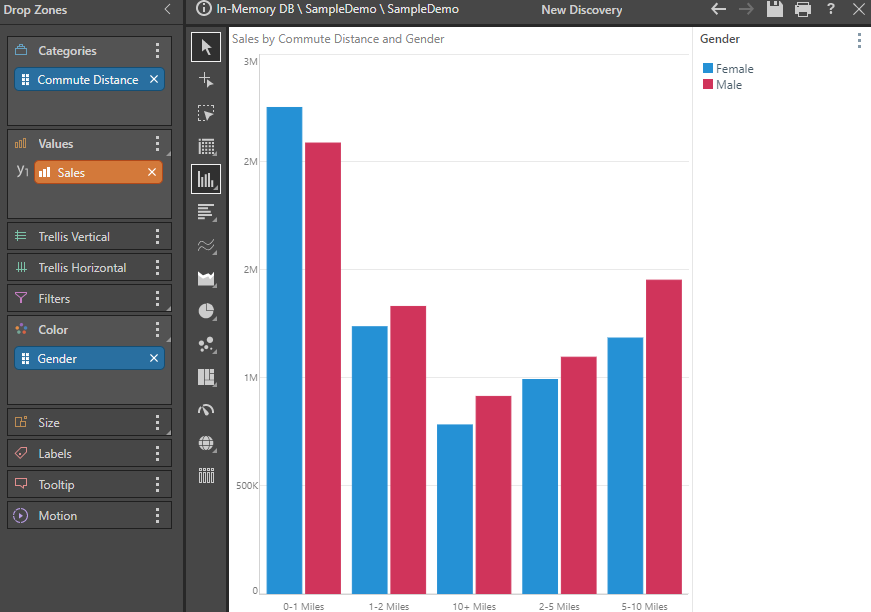
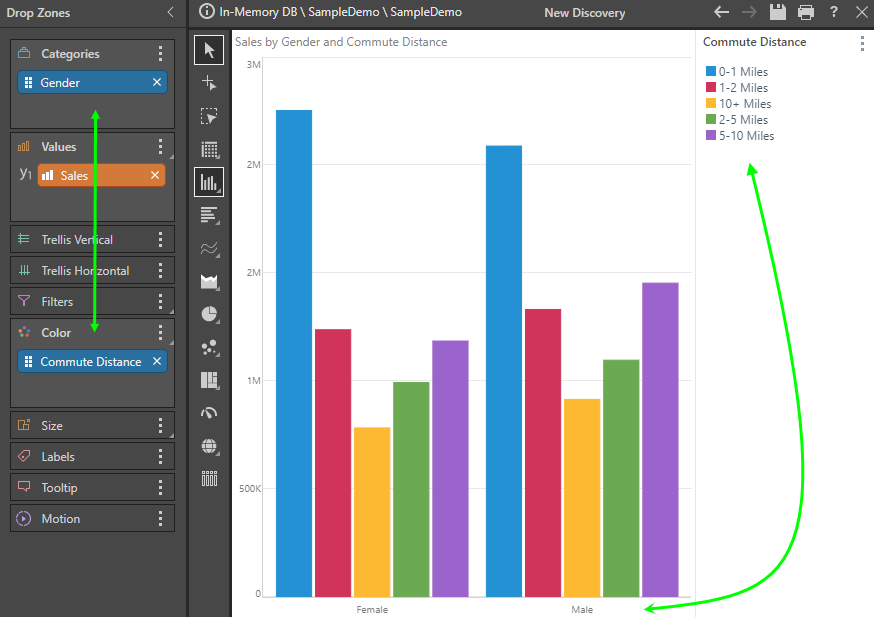
Affecting column, bar, line, area and points charts, the categories and series (color) drop zones are swapped.
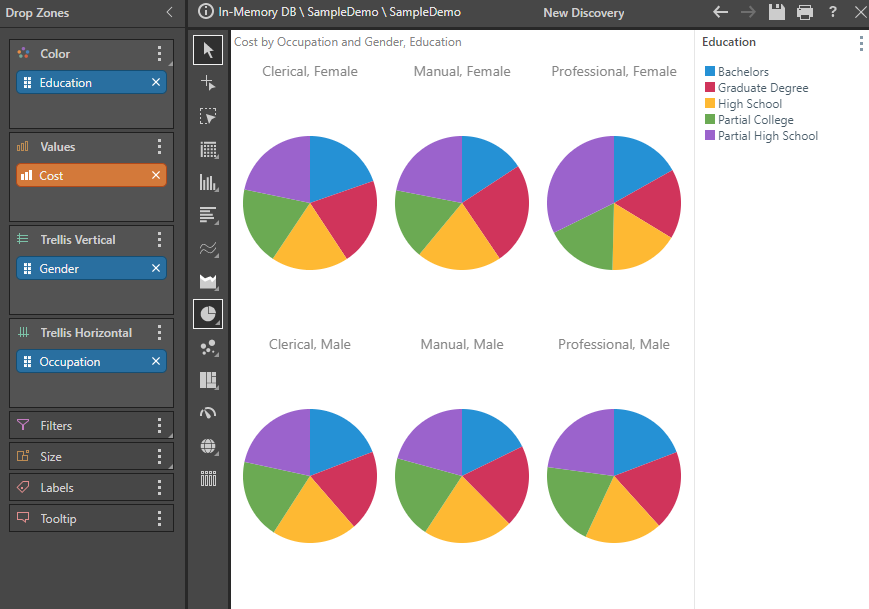
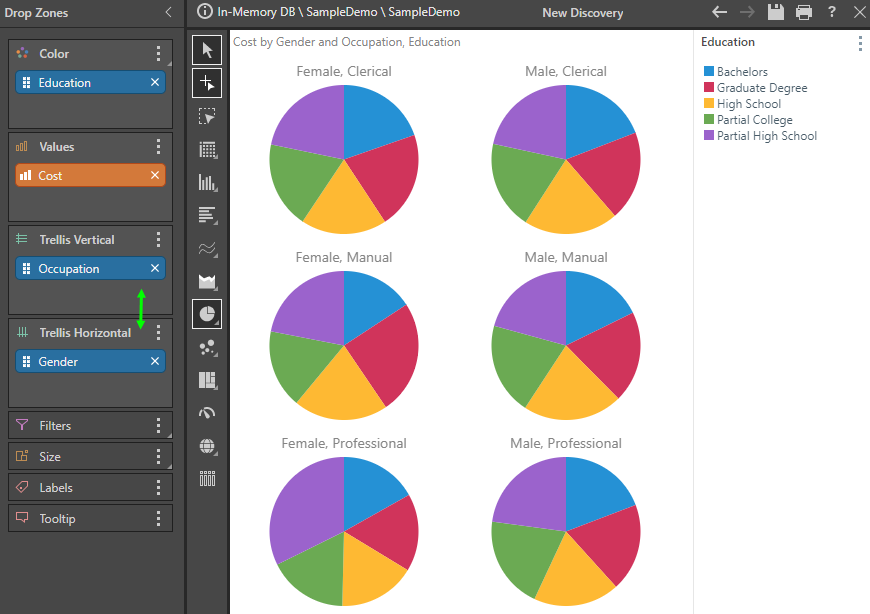
Affecting pie, doughnut, pyramid and funnel charts, the horizontal and vertical trellis drop zones are swapped.
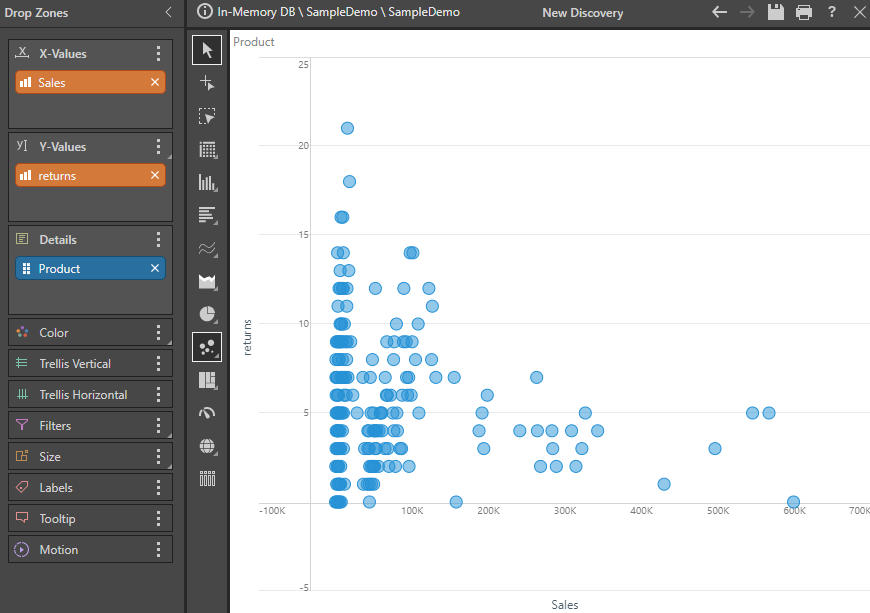
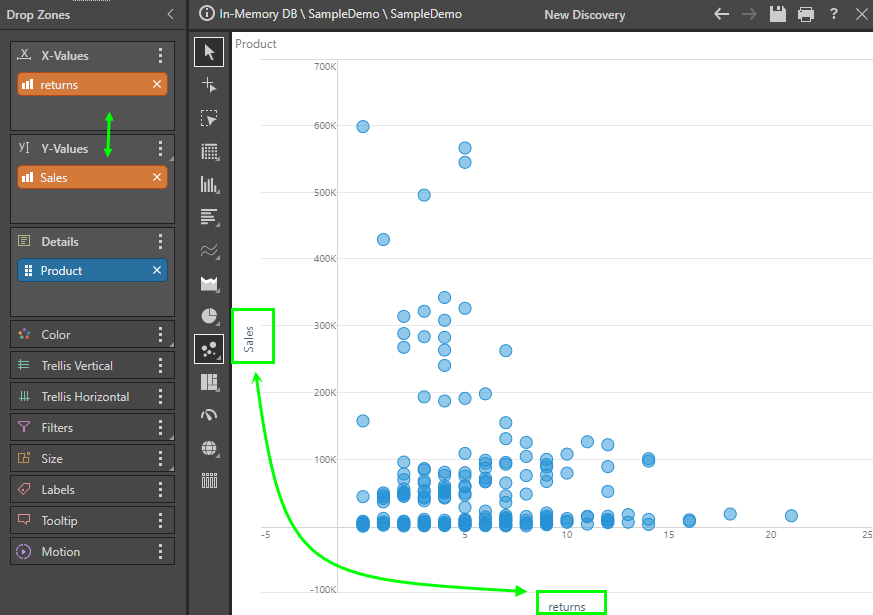
Affecting scatter and bubble charts, the X and Y value drop zones are swapped.
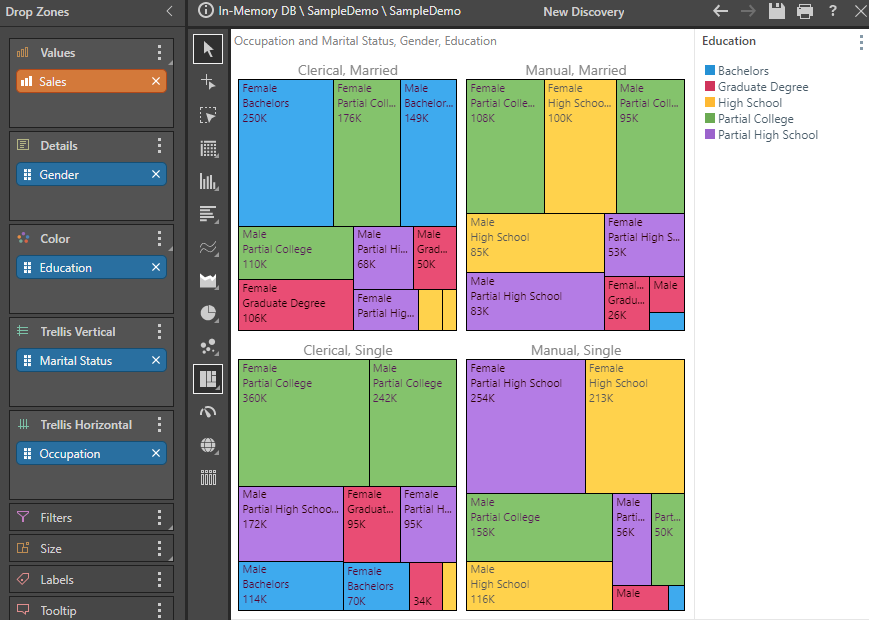
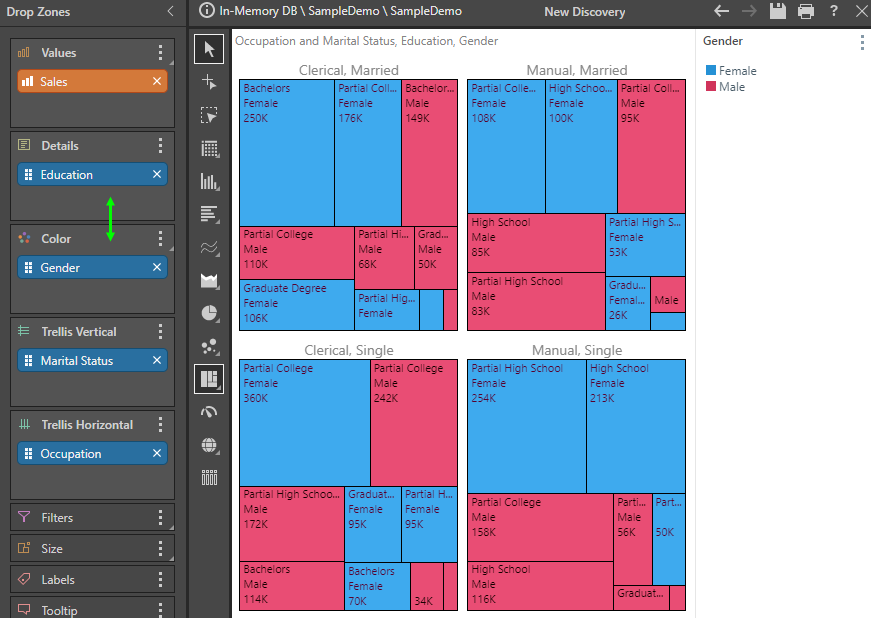
Affecting tree maps, circle packing, word cloud, Sankey and sunburst charts, the detail and color drop zones are swapped.