When you add the same hierarchy to both the Color and Shape drop zones, Pyramid will display the hierarchy's elements with a combined color / shape legend.
While other tools display the attributes across two different legends, Pyramid's combined legend enables the report-creator and viewers to easily read and interpret the data, using one legend rather than two.
Combination Legend
Each of the Manufacturers is represented on this line chart with a Color and a Shape. The Legend (highlighted in green below) shows both.
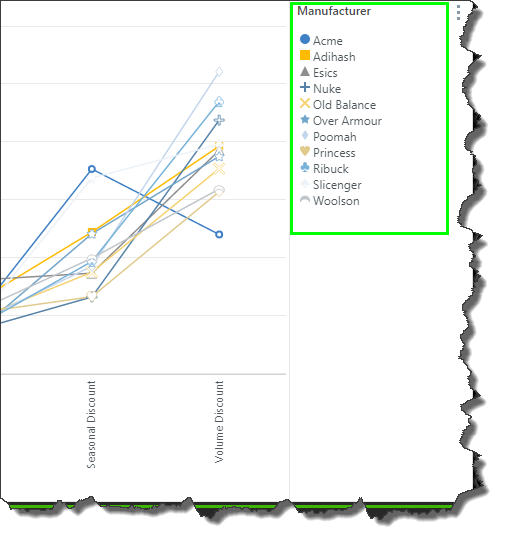
Separate Shape and Color Legends
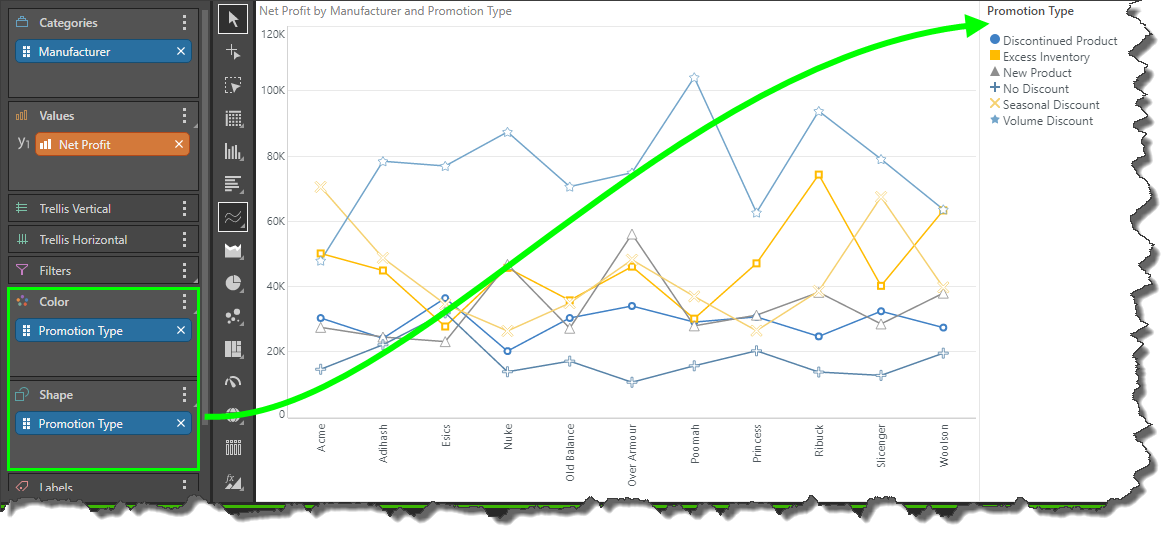
In the example below, two different hierarchies were added to the Color and Shape drop zones. We can see that two different legends are produced accordingly.
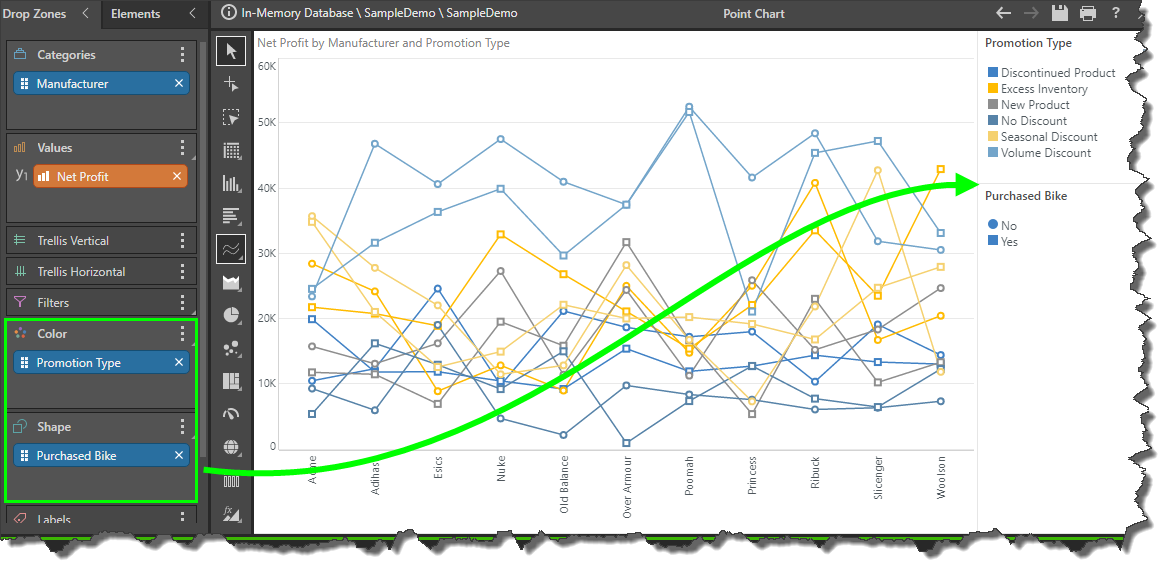
However, in this example, 1 hierarchy was added to both the Color and Shape zones, producing a combined color and shape legend. The result is a chart that is easily interpreted and understood, with no need to refer to 2 separate legends for the same elements. Instead, each element is represented in the legend by a single colored shape, exactly as it appears in the chart: