By default, maps are disabled in the Admin console. To allow users to build map visuals in Discover Pro, maps must first be enabled from the Geospatial tab in the Admin console.
Geocoded Maps
Geocoded maps convert location descriptions (like the name of a country, state, or city) into a location on the map. For example, the following Country hierarchy lists six countries by name. When the hierarchy is added to the Map Location zone, each country listed within it is designated by a bubble or shape in the map:

Geocoded mapping is useful if your data model contains geolocation hierarchies that describe locations, as opposed to listing latitudes and longitudes. They are also important if you want to create shape maps, as shape maps support geocoding only (not longitude and latitude).
See Bubble Maps, Shape Maps, and Geo Heat Map to learn more about geocode maps and how to build them.
Administration Levels
Click here for a list of administration levels (starting at the country level) and post codes supported for each country. For instance, in Australia there are 6 administrative boundaries, from level 0 to level 5, and 2 post code boundaries, each of which is supported.
Note that shape (polygon) data for cities and addresses is not supported. These levels should be plotted using the bubble map instead.
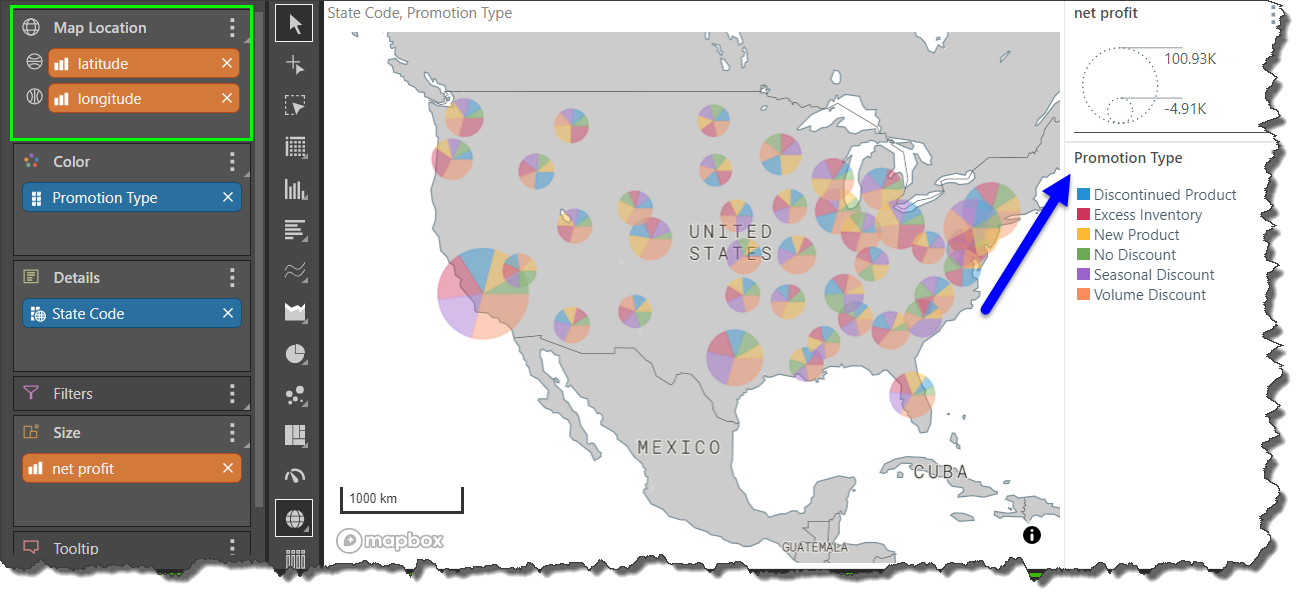
Latitude/ Longitude Maps
If your data model contains longitude and latitude measures, you can add these to the Map Location zone to generate a map based on the latitude and longitude, rather than geospatial locations.
See Bubble Maps and Geo Heat Map to learn more about using latitude and longitude coordinates to build maps.
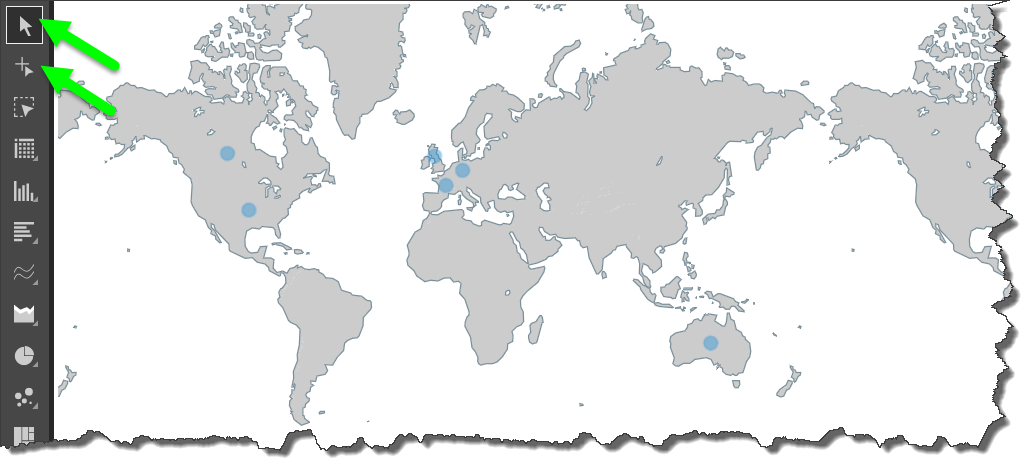
Map Navigation
With the Default or Selection tools enabled, you can:
- Click and drag to move the map.
- Right-click to spin the map and change the perspective.
- Use the mouse scroll wheel to zoom in and out.
Building Maps
Map Visuals
The map visuals are:
- Bubble Maps: Display data points as bubbles or pie bubbles.
- Shape Maps: Display map data in polygon shapes.
- Custom Maps: Build maps based on custom shape map data.
- Geo Heat Maps: Display the measure in bubbles, with a range of colors representing the spread of values.
- Layered Maps: Display data points as bubbles and map data in polygons. This produces a "combo" Bubble and Shape map.
Map editing and customization
- Map Quick Styles: Pyramid supports the following map types: flat map, topology map, street map, satellite map, satellite, and street map.
- Geo-Boundaries: Create custom columns representing the geographical locations inside and outside of a given boundary.