Colors types can be used to adjust gauges in different ways, depending on the gauge. They are effectively techniques for conditionally formatting the graphic by including an extra effect. These can be driven from either the Color drop zone or via the Conditional Formatting dialog. Both the Color drop zone (via sub-drop zones) and the dialog lets users choose both the type of coloring model and the type of logic that should be used to drive the "color" graphic adjustment.
Color Types
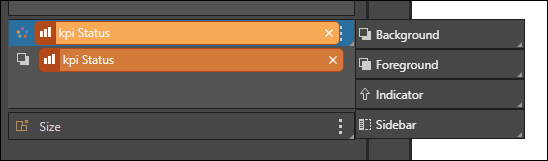
There are four types of color adjustments possible with Gauges: Background, Foreground, Indicator and Sidebar. The options depend on the gauge type.
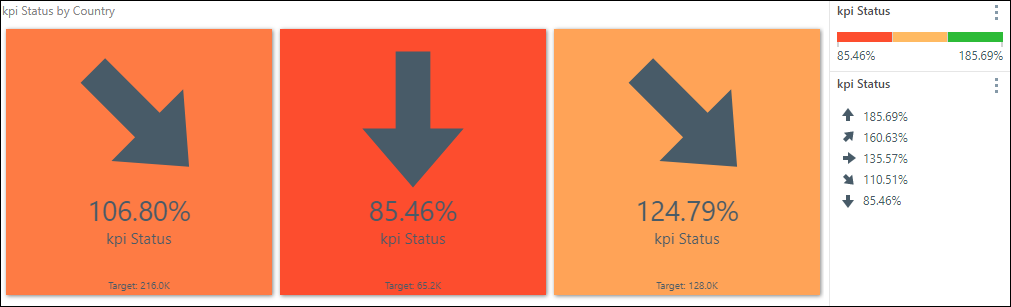
Background
The color is displayed on the background of the visualization.
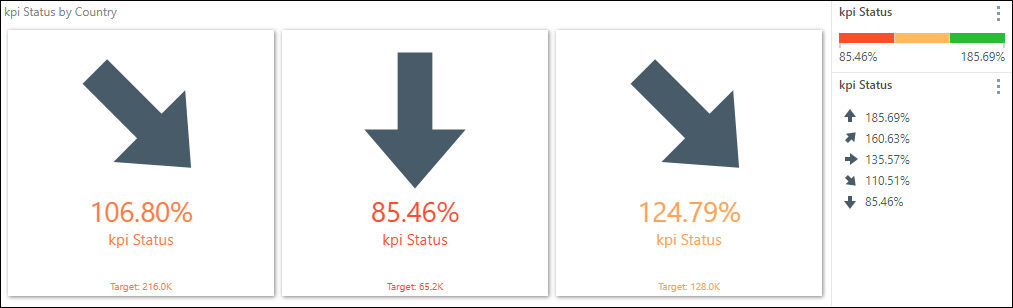
Foreground
The color indicator drives the color of the text in the visualization.
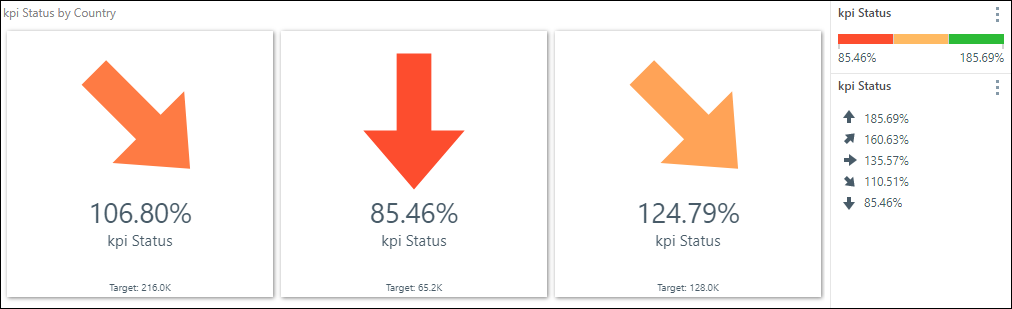
Indicator
Indicator drives the color of the visualization's status indicator.
Sidebar
Sidebar displays a color-driven bar along the side of the visualization. This is supported by gauges only.

Changing the Color Type
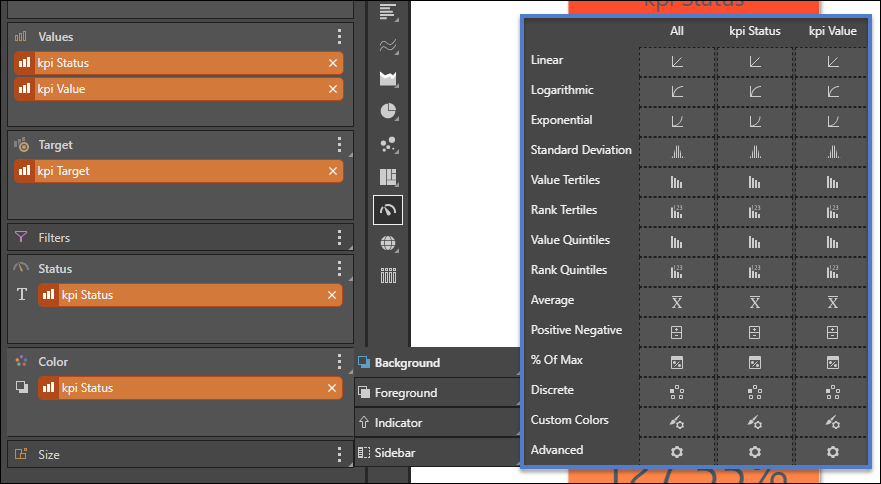
To change the color indicator via the sub-drop zones, open the Status zone's sub-menu. This can be done in two ways:
Method 1: click the arrow (red arrow below).
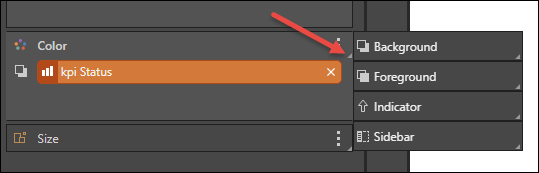
Method 2: drag the status chip up over the Color zone label.
Changing the Color Logic
Users can specify the type of logic that should drive the color indicator. For instance, you may want to drive the status indicators by linear logic but have the color logic driven by positive negative logic, in order to spot positive and negative values at a glance.
Use either of the two methods listed above to open the logic sub-menu, and drop the status chip onto the required logic type.
Click here to review the different types of color logic.
- Conditional Formatting is an alternative technique for making these adjustments.