KPIs are comprised of actual values, target values, status values, and bands.
Status values are a logical comparison of the actual to the target to express whether the actual is dong better, worse or the same in comparison to the target value. To make the analysis meaningful, the status values need to be reviewed in the context of ranges or 'bands' which are the numerical ranges that describe and define 'better', 'worse', and 'the same'.
Dynamic vs Static KPI Bands
While it's obvious that the status values driving KPI's should dynamically change based on the query and its context - the concept of dynamically changing the banding is not so obvious. Yet, in many cases it makes a large difference to how KPI's are deployed and offers a paradigm shift in how they can be calculated.
For example, if we want to measure the sales growth, quarter on quarter, of a customer by state, we could simply design our KPI's to reflect that states that exceed 10% are doing well, between 0-10% are doing OK and those that are selling less in a given quarter are doing badly (less than 0%). While these static bands of success are somewhat useful, they couldn't modulate to reflect seasonality: (maybe sales over 25% in summer is good, while 10-15 is just OK, and below 10 is bad); nor could they reflect the relative performance of the state cohort (5% maybe a low value, but it may be really good if it's the highest sales growth amongst any state.
With this in mind, having individual calculations to drive the bands, would allow users to build smarter, more responsive and ultimately more relevant KPI metrics.
KPI's as Conditional Formatting
KPI's are, in effect, an advanced form of conditional formatting - adding and adjusting both an icon and color based on values to highlight information in the visual beyond its own visible values. Dynamically setting the status metric and banding metrics in a KPI are sophisticated techniques for conditional formatting.
Data model driven KPI's in MS OLAP and Tabular models use predetermined bands of -1, 0, 1. They cannot be changed or manipulated from inside Pyramid.
Building Dynamic KPI Bands
Start by enabling dynamic banding from the Bands panel in the KPI designer.
In the Custom KPI designer, users first pick a status 'model' to describe the type of comparison logic they wish to employ:
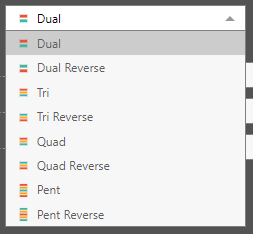
- Dual/Dual Reverse: comprises two bands denoting better or worse, or vice-versa.
- Tri/Tri Reverse: three bands denoting better, the same, or worse, or vice-versa.
- Quad/Quad Reverse: four bands denoting better, the same, or worse, or vice-versa.
- Pent/ Pent Reverse: five bands denoting much worse, worse, the same, better, and much better, or vice-versa.
Band Colors
The default colors for KPI are driven by the band settings of the chosen theme. You can change these colors in Discover through the advanced Conditional Formatting dialog, once you add the KPI to a query.
Creating the Banding Logic
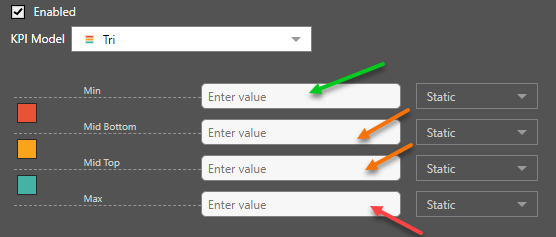
Once the model is chosen the designer will reflect the banding levels and the direction of the logic (red highlight below). For each band, the user needs to provide the numerical values that will determine the boundaries of each band.
In the example below, the user needs to supply four values:
- The lowest value (green arrow)
- The boundaries of the next to bands (orange arrows)
- The highest value (red arrow)
For each boundary, the user can use four methods for supplying a value using the value dropdown list for each band boundary (red highlight below). Each boundary can use a different technique.
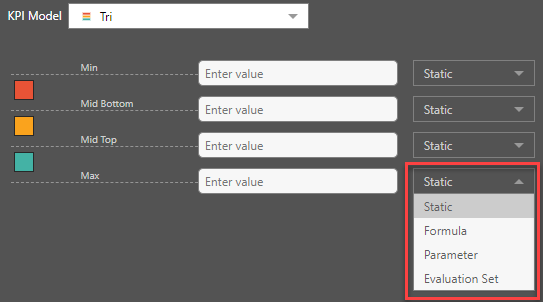
- Static: is a static number.
- Formula: is a dynamic value generated using a custom calculation.
- Parameter: is a (semi) static value generated from user input during runtime driven off a parameter.
- Evaluation Set: is a dynamic value generated from querying statistics from a set of figures.
These are explained below:
Static
These are the simplest boundary values to provide for KPI bands. They are simply hard coded, static numbers that represent the boundaries for the different bands in the KPI definition.
Care should be taken to ensure that the band values are in numerical order to avoid errors.
Formulas
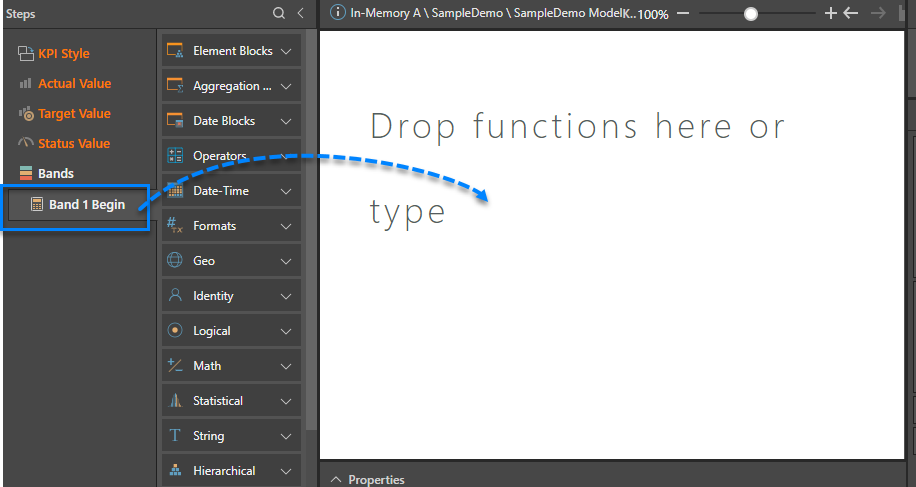
Formulas provide the most flexible and powerful technique for defining dynamic bands. Each boundary element can be set to a custom formula. When selected as such, a new tab appears in the Custom KPI designer.
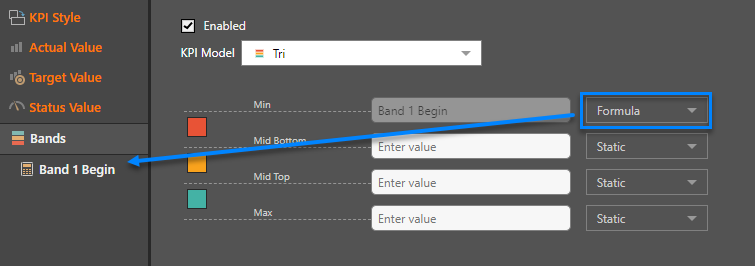
The new tab allows the user to formulate and set a custom formula for deriving the value of the boundary in the same way they defined the actual and target values.
- Click here for details about building formulas.
Parameters
Parameters provide a UI based element to allow end users to supply values into calculations during runtime. In much the same way, variables can be used to define boundary values for one or more bands. As such, parameters provide a semi-static interface for KPI banding.
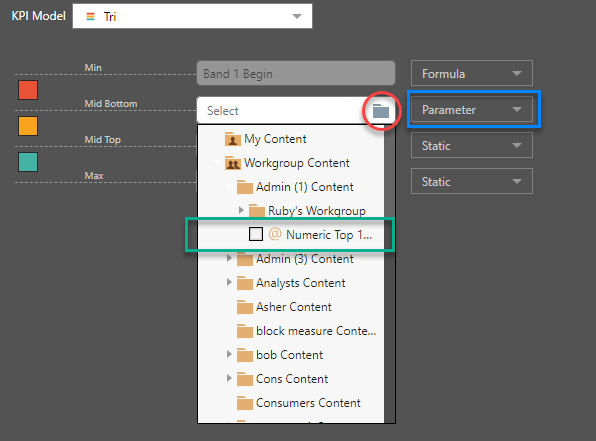
After choosing parameters, click the folder icon (red circle) and select the required parameter from the folder tree (green box).
Evaluation Sets
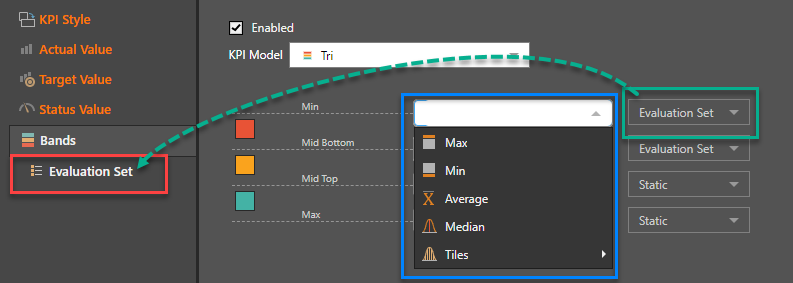
Evaluation sets (or 'Lists') are a powerful technique for creating dynamic boundary values quickly. In many scenarios they are the perfect vehicle for building dynamic bands for a cohort of items. After selecting the option, the user needs to pick a set of elements as the cohort "set' from which the values will be drawn (red highlight).
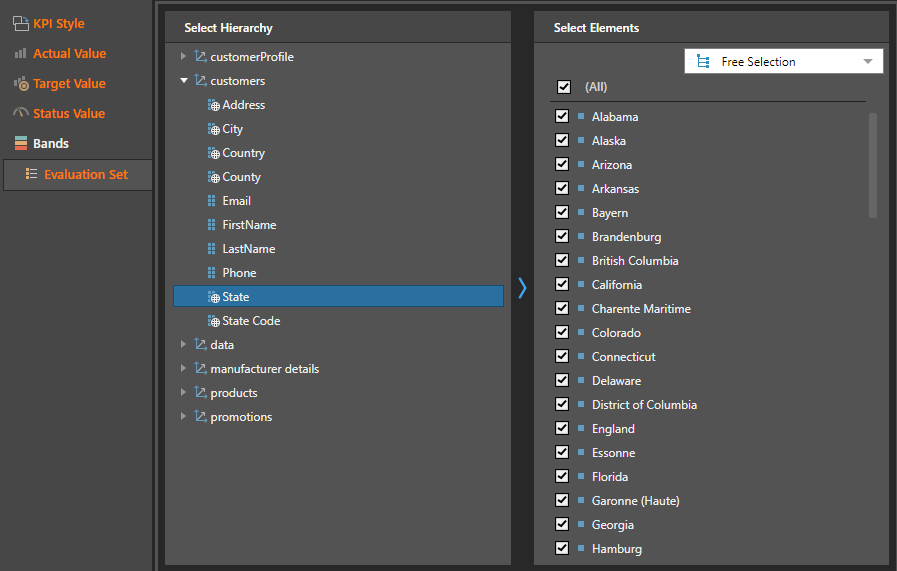
Clicking the button will present the interface below. Here, the user selects elements from the relevant hierarchy in the model using either hierarchy levels, previously defined custom sets, or a free selection of elements.
Then, they can set for each boundary the type of statistic to be drawn from the set (blue box above). The statistics available are:
- Max: use the max value of the cohort evaluation set as the boundary.
- Min: use the max value of the cohort evaluation set as the boundary.
- Average: use the average value of the cohort evaluation set as the boundary.
- Median: use the median value of the cohort evaluation set as the boundary.
- Tiles: select a percentile of the cohort evaluation set and use it as the boundary. You may select from:
- Percentiles (1/100)
- Tertile (1/3)
- Quartile (1/4)
- Quintile (1/5)
The Evaluation Set capability is NOT operational without a set definition.
Evaluation Set Statistic Values
The values driving the boundaries are derived from running the status value calculation in the KPI definition for each element in the evaluation.