When you open a presentation at runtime, you can use the Chatbot to interact with your visual data in an intuitive way using natural language. The Chatbot is opened per analytic query, from its panel tools, and lets you explore your data spontaneously, helping you to focus on and understand the data in an organic and unrestricted way. You might use the Chatbot to split data, for example, by region (if you are based in one area) or to change the visualization type.
Any changes you make to the runtime presentation will be lost either once you leave the runtime presentation, or if you reset your presentation. If you want to save your changes, you can make use of Analyze Further.
Note: This feature is available with the Enterprise Edition license only.
You can only make use of this functionality if your administrator has selected to Enable Generative AI in the AI Settings page of the Admin Console. Otherwise, the function is not available for use.
Using the Chatbot at Runtime
Opening the Chatbot
To open the Chatbot from your presentation at runtime:
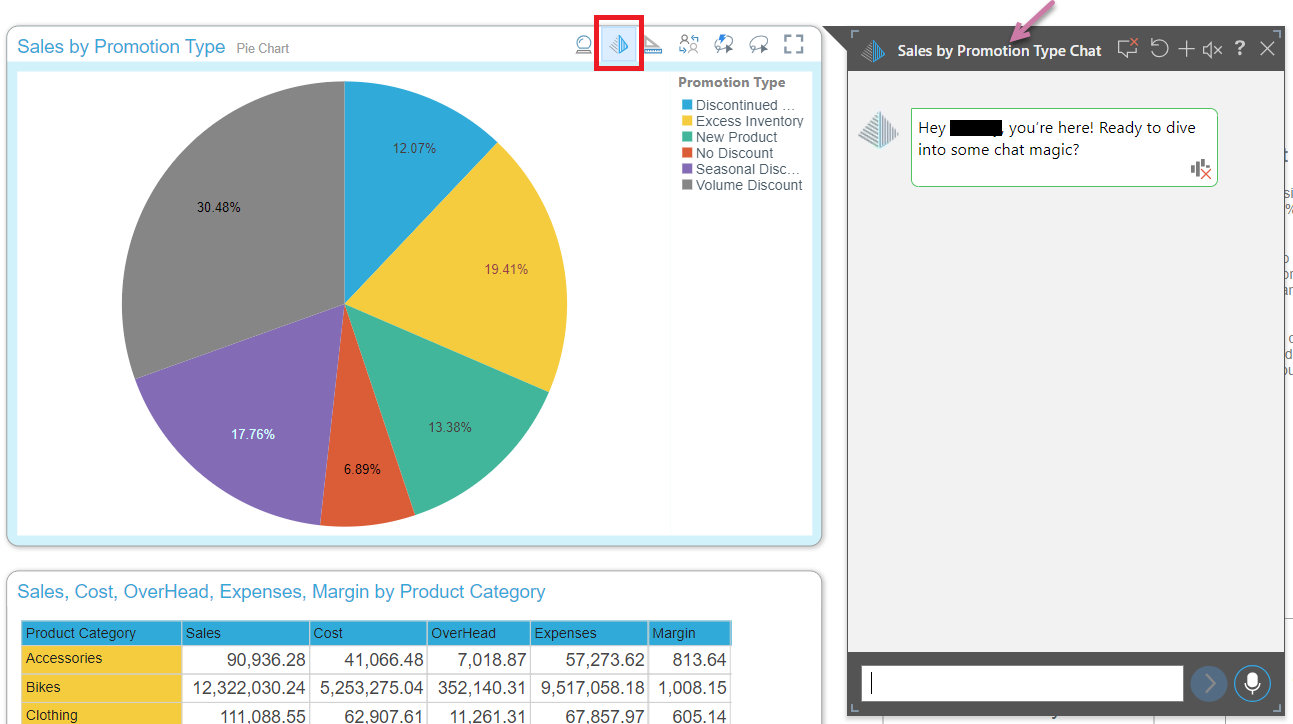
- Hover your cursor over the panel that contains your visual.
- Click the Chatbot button (red) to open the Chatbot.
The panel tools are shown, typically to the top-right of the panel.
The Chatbot opens in an available space. It is important to note that, when you use the Chatbot, you are exploring the single visual whose title is shown in the Chatbot header (purple arrow).
Tip: For information about the other panel tools that you can see at the top-right of each of your visuals, see Panel Tools.
Ask your Question
Now that the Chatbot is open, you can ask your question using one of these methods:
- Type your request into the chat's text box and click Enter.
- Hold down the microphone button and say your request. Release the button when you are finished.
You might want to ask questions such as:
- "Show as grid" if you are currently viewing a pie chart and want to see the same data in a grid.
- "Split by gender" to show the same data split into male and female columns.
- "Remove region x" to remove sales data relating to a region you are not interested in.
- "Forecast Sales for 6 months" to make a projection, estimating what sales might be over the next six months.
- Click here for a walkthrough exercise that explores the Chatbot at Runtime