Automated Insights use Artificial Intelligence to generate a natural language analysis of the discoveries on your slide on the fly. You can use the information in the insights panels or pop-ups to help you to better understand your data and discoveries.
When viewing your presentation at runtime, there are two types of automated insights:
- Smart insights: These insights are opened at runtime from the Smart insights panel tool or may be accessed on the fly using the Chatbot. They provide analytic information about the specific discovery they are associated with, and, if you are using the Smart insights tool, you can filter your insights to contain light, advanced, or categorical levels of detail. Note: Each of these levels offers a different amount of depth and contains various kinds of information.
- Slide insights: These insights are an aggregation of the smart insight information across the slide. These insights are presented as either a text box or tooltip on the slide and provide insight information that relates to all discoveries on the slide. Slide insights may be present on the slide as text or a tooltip
Depending on your selections, the insights include a range of valuable analytical information; average and median values and the spread of values, Pareto analysis, correlations, trends, outliers, and even forecasting.
In all cases, Insights are dynamic, updating in real time to reflect any changes to your discoveries or selections. This means, for example, that every time you change a slicer selection, any Slide insights are refreshed to reflect your filtered discovery data.
Note: This feature is not available in the Community Edition.
Smart Insights
Important: Smart insights can be used in Discover and Present. The content is updated whenever the Smart Insights panel is opened in Discover, whenever the contents of the visual are changed, and whenever the presentation is refreshed at runtime. Alternatively, you can add similar Text Field insights in Publish and Present. For more information, see Generated Insights.
Opening the Smart Insights panel
To open the Smart Insights panel from your presentation at runtime:
- Hover your cursor over the panel that contains your visual.
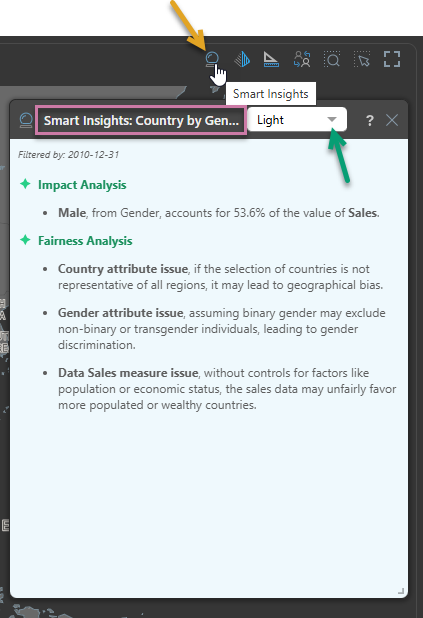
- Click Smart Insights (orange arrow below) to open the Smart Insights panel.
- Select the "level" of information that you want to show in the pop-up using the dropdown list (purple arrow).
The panel tools for your visual open, typically to the top-right of the panel.
The Smart Insights panel opens in an available space.
Note: When you use the Smart Insights panel, you are exploring insights information about the visual (the analytic content) whose title is shown in the panel header. If the title is too long to be displayed in the header, you can hover over the name to show it, in full, as a tooltip.
Tip: For information about the other panel tools that you can see at the top-right of each of your visuals, see Panel Tools.
Smart Insight options
Light analysis
Light analysis offers simplified metric analytics, covering measures but not categories. Depending on the amount of data in the query, Light insights may display the following information:
- Basic Facts: Standard metric analysis, including the average, maximum, minimum, and dispersion.
- Pareto Analysis: The value's total and top n and bottom n, that account for a certain percentage.
- Relationships: Any positive or negative metric correlations and relationships.
- Trends: Uses regression analysis with r-squared and slope coefficients to explain how changes to a metric affects another metric.
- Forecasts: Best fit forecasting (across eight different algorithms) if the query contains a date-time hierarchy to predict whether a value will increase or decrease over a certain period and by how much.
Advanced analysis
Advanced analysis displays more in-depth metric analytics. Depending on the amount of data in the query, Advanced insights may display the following information:
- Basic Facts: In addition to the basic facts generated by the Light analysis, this also shows the median and standard deviation.
- Pareto Analysis: Same as the Light analysis.
- Relationships: Same as the Light analysis, with the addition of a correlation statistic.
- Trends: Same as the Light analysis, with the addition of displaying the closeness of fit score and the slope correlation.
- Forecasts: Same as the Light analysis, but it also stipulates which forecasting algorithm was used, and the range of fluctuation.
- Outliers: The multi-variate outlier analysis displays the top three most outstanding data points in the query. It also shows the probability density for each outlier.
Categorical analysis
Categorical analysis shows simplified category / element analytics. Depending on the amount of data in the query, Categorical insights may display the following information:
- Comparatives: Compares the metrics for each category with the category that has the highest value for the same metric.
- Correlations: Displays any positive or negative correlations between measures for each element where a correlation exists.
- Forecasts: Best fit forecasting if the query contains a date-time hierarchy, predicting for each category whether the value will increase or decrease over a certain period and by how much.
- Outliers: A light version of the Advanced analysis.
Summary
The Summary summarizes the visual at a high level. What is in the Summary depends on the LLM used and the content of the visual itself. You can regenerate a new Summary by changing the selection from your dropdown list to any other option and then returning to Summary.
Fairness analysis
If you are using an LLM to generate Pyramid content, and your administrator has enabled Fairness Analysis in your AI settings, then some fairness analysis content will be generated by the LLM and added to the content in your Smart Insights panel or any Slide or Page Insights added to your presentation or publication, respectively.
The fairness content, generated by the underlying LLM, is created through an analysis of the measures and attributes used in the discovery (but not the values of those measures and attributes) and provides insights into any bias that may disproportionally harm or benefit any group, particularly historically disadvantaged groups.
Getting insights using the Chatbot
In the runtime presentation:
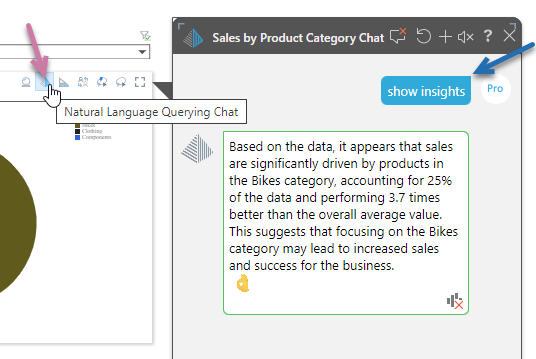
- Open the Chatbot from the panel tools (purple arrow below).
- Explicitly prompt (say or type) "show insights" or "get insights" into the chat field and press enter. Your prompt is added to the chat (blue arrow). Smart insights relating to the discovery that you are querying are displayed in the chat window as a response:
Slide Insights
Your presentation designer can add text boxes, dynamic text or placeholders, or dynamic tooltips that include slide insight data to your slide wherever they feel they will be appropriate. These fields and dropdown lists are dynamically populated with analytic data at runtime, either on load (in the case of text boxes) or when a tooltip is opened.
Slide insights in a text box
If the slide was designed to include a Slide Insights text field or a custom dynamic text field that gets replaced with insight information at runtime, that field is updated to include insight information about all discoveries on the slide on load:
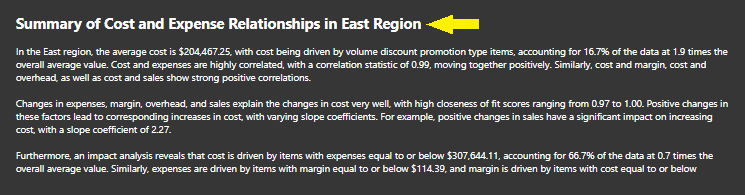
Note: This example panel reflects the filtering applied to discoveries that are filtered using the "region" slicer, where "east" is selected (yellow arrow).
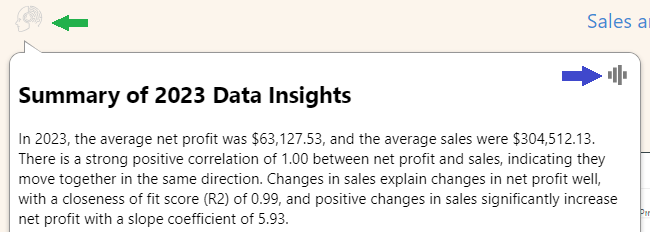
Slide insights as tooltips
If slide insights are added to the slide as a tooltip associated with an illustration, your reader can hover over the icon (green arrow) with their cursor to view the AI generated insight information in a pop-up. They can also click the Audio icon (blue arrow) to hear the information in the pop-up.