Scale Modes define what should happen to your visual to try to fit it into the space available in your publication. For example, if you select Scale to Fit for a grid, its text might be scaled down to try and fit all its columns and rows inside its bounding box. You would typically change this option to improve the appearance of your visuals and to ensure you include as much data as possible.
It is important to note that each visual is contained within a bounding box which retains its actual size on the canvas regardless of this setting. Scale modes allow you to set the scaling behavior for the visual inside this container only.
The default scale mode option is Scale Down Only. For more information, see Scale Down Only.
Scope of Scale Mode
These options impact the visual in Publish Pro; the visual appearance being reflected in any output that incorporates the visual as an image: Excel,HTML, PDF, PNG, Power Point, and Word. (Note: In Excel, Grids are not represented as images.)
Charts
For any charts (visuals that are neither Grids nor Gauges), scaling is automatic and applies based on the size of the bounding box rather than on the selected Scale Mode. This means that, if your visual is a Column Chart, say, you resize its container to resize the visual:
Note: The preceding example also shows how to Show or Hide the Chart's Legend to increase the available real estate. For more information, see Legends in Publish Pro.
Grids
For Grids, the Scale Mode indicates how the visual should be scaled; the example shows how the No Scale scaling option retains font sizes and other formatting and Scale to Fit resizes that text, and the columns and rows, to attempt to fit all content into its bounding box:
Note: The preceding example also shows how to disable "Miniature Visuals" when the size of the bounding box is below a certain size. For more information, see Miniature Visuals in Publish Pro.
Gauges
For Gauges, the example shows how the No Scale scaling option retains font sizes and other formatting and Scale to Fit resizes that text to fit all content (tiles) into the bounding box:
Note: The preceding example also shows how, in addition to general scaling controlled by these features, it is possible to enable auto scaling on KPI Gauge labels. For more information, see Auto Fit Labels in Publish Pro.
Changing the Scale Mode
There are two ways to access the Scale Mode menu; from the Context Menu or from the Component ribbon.
Context Menu
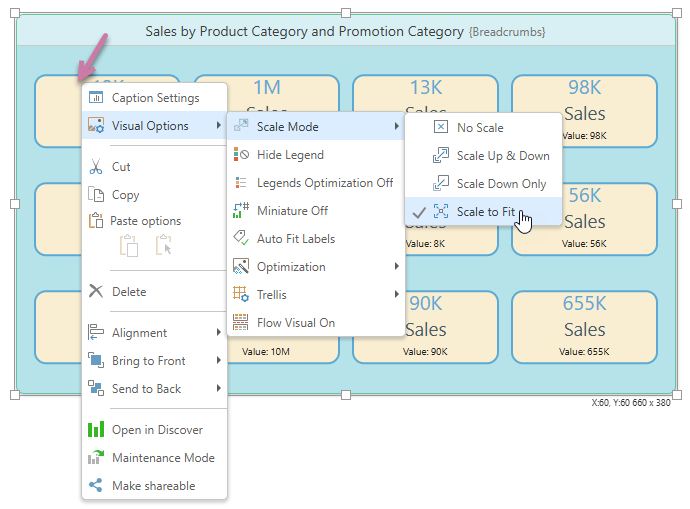
Right-click the visual and from the context menu select Visual Options > Scale Mode > <Scale Option>:
Component Ribbon
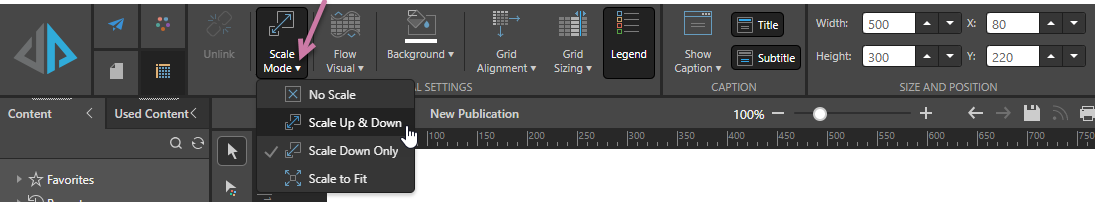
Select the visual on the canvas, then choose Scale Mode > <Scale Option> on the Component ribbon:
Scale Modes
No Scale
Choose No Scale if you don't want to apply any scaling to your visual. In this case, the visual is not scaled up or down. The visual components (font, cells, and so on) remain the standard size, regardless of the size of the bounding box or the content within the bounding box.
Note: If the visual is larger than its bounding box, some content may not be visible on the canvas or in your published output. You can see if you have lost some visible content by switching to Scale to Fit temporarily.
Scale Up & Down
Not used in Publish.
Scale Down Only
Not used in Publish.
Scale to Fit
The visual will be scaled to fit within the bounding box, regardless of page size.
This option is relevant to Grids and Gauges.
- Add a Matrix Grid to your publication.
- Select the visual and then Scale to Fit.
- With Scale to Fit enabled, re-size the panel. The grid scales accordingly:
- To return to the default settings, click Scale to Fit again.
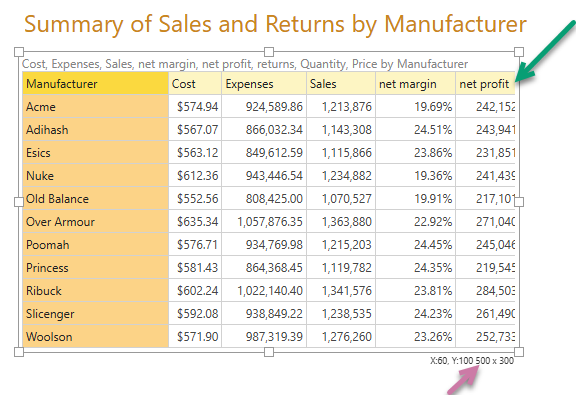
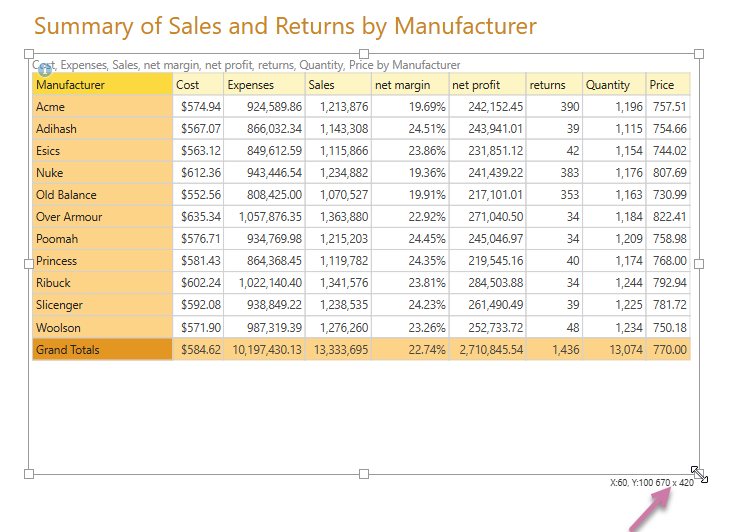
By default, if the Grid is too large to be shown, some content is simply "off the page." In the following case, there should be eight columns but the fifth is cut off prematurely (green arrow). There should also be a totals row, but this is not visible at all.
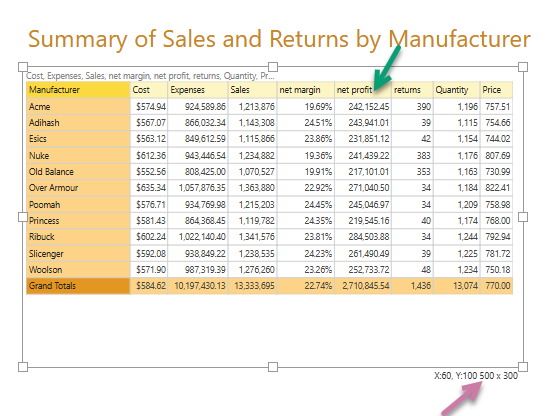
The Grid is automatically re-sized to fit the available space. Note that this shrinks the fonts throughout, resulting in the extra columns and row being visible in the panel:
Interaction with Miniature Visuals
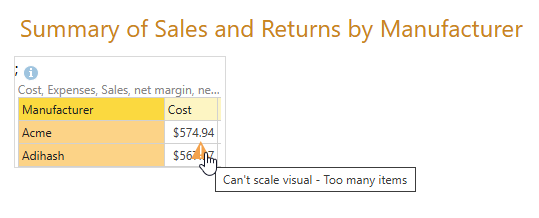
If you have a grid with Scale to Fit enabled and Miniature visuals disabled; when you reduce the size of your visual below the level of visibility, you might see the Can't Scale Visual warning:
This warning means that your visual can no longer be reasonably scaled to fit its container. If you see this warning, you should take one of the following actions:
- Disable Scale to Fit. This stops Pyramid from trying to scale the contents of the visual to fit its container. The content of the container may end up too big to be shown on the page.
- Enable Miniature visuals. This allows Pyramid to replace the visual with a miniature visual tile.
- Use the drag handles to make the container larger, allowing more of the visual to be shown.