Slicers are used to filter the data in your visualizations in discoveries, presentations, and tabulations. They are also used to filter data at build time in publications.
A "slicer" comprises a list of member elements from a model hierarchy that you can use to filter the query by one or more elements at runtime. For example, if you add the Country hierarchy to a dropdown slicer, you can use it to filter the data query to include data from just one selected country from the hierarchy.
Slicers can also be used with measures to drive slightly different mechanisms, including:
- A "switching" effect, where the measure can be swapped out using the measure slice. These are known as variable measure sets.
- A "parameterization" effect, where a VALUE filter can be built using a given measure to numerically filter the query. (See below for more information.)
- For more information about Slicers in Discover, see Filter Drop Zone.
Note: The Filter drop zone in Discover Pro is primarily used to add 'slicers' or data driven filters to the query.
Creating Slicers in Tabulate
You create slicers using the Add New Slicer icon in the Toolbox menu to the left of your worksheet:
-
Click Add New Slicer.
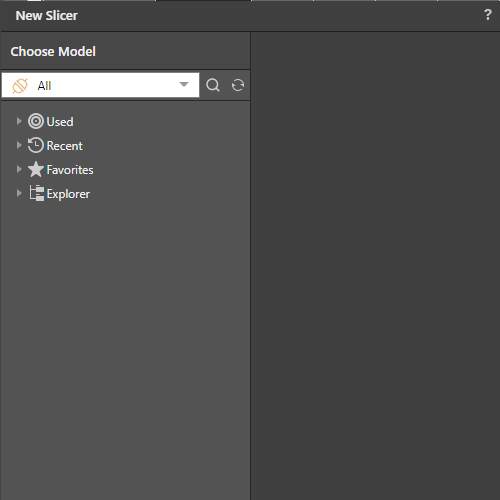
The New Slicer dialog opens:
-
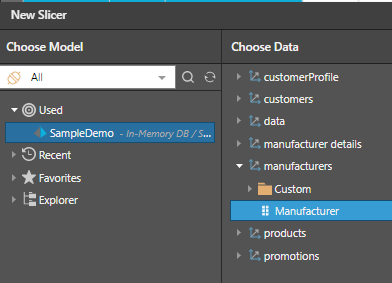
Select the Model you want to create the slicer from, then expand the required data group, and select the required item (in this case, Manufacturer):
-
If the hierarchy you selected is from a different model to your Tabulate spreadsheet, use Cross Model Mapping to define the relationship between the model used by the data in Tabulate and the slicer's model.
A new slicer is created and displayed at the top of the worksheet:
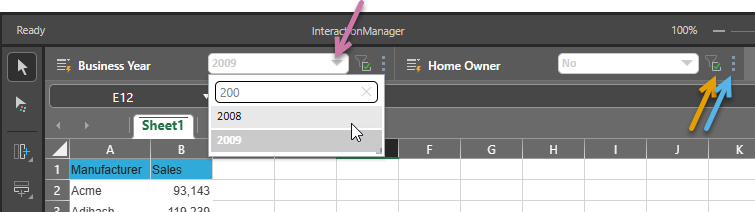
You can now select different values from the dropdown list to view different slices of data (purple arrow above), enable and disable the slicer (orange arrow), and either drag the slicer to a different position or open the slicer context menu from the Ellipse (blue arrow).
Changing slicer settings
Once your slicer is added to your spreadsheet, you can edit its settings and thereby its options and appearance from its Settings menu (blue arrow below):
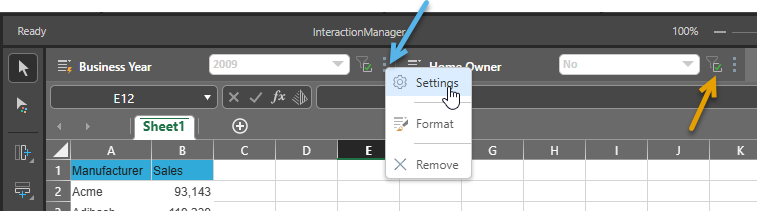
Slicer Settings
To change slicer options and other advanced settings, click the Ellipse icon (blue arrow) to the right-hand side of the slicer and then Settings. The Slicer Settings panel opens.
For more information, see Slicer Settings in Tabulate Pro.
Slicer Formatting
To change the formatting of your slicer, click Ellipse > Format. The Formatting panel opens.
For more information about these settings from the Discover Pro materials, see Slicer Formatting.
Remove Slicers
To remove the slicer from the tabulation, click Ellipse > Remove.
Tip: If you are unsure about whether you want to remove the slicer, you could temporarily disable it instead. This is done using the filter button to the slicer's right-hand side (orange arrow).
Note: Tabulate populates the rows and columns based on the query, so the number of rows and columns is determined by the original query. By applying slicers, certain rows and columns might result in a "null". The number of rows and columns will not be reduced when you insert a slicer.