Visualization panels show several functions as buttons when you hover your cursor over the visual. Depending on the design preferences of the presentation's author, the panels may be displayed by default, or you may need to hover over the visual to display its panel functions.
Panel Tools
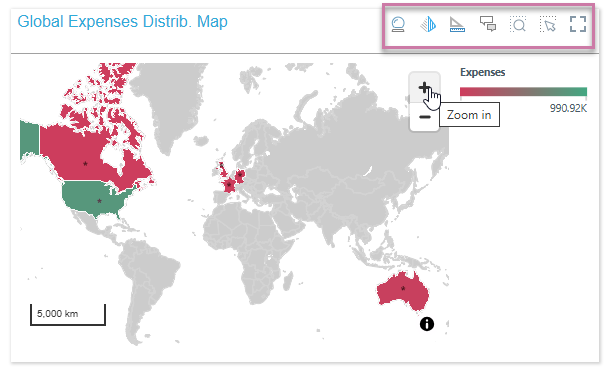
Note: Which buttons are shown, and therefore which options are available on hover, is configurable in your runtime settings. For more information, see Runtime Settings in Present Pro.
Core Panel Tools
- Smart Insights: Click the crystal ball to produce an AI-driven analysis of the current visual, with the output returned in natural language.
- Chatbot: Click the pyramid icon to open the Chatbot and interact with visualizations in an intuitive way using natural language.
- Analyze Further: Click the analyze further icon to open your visual in Discover Lite for further analysis. Note: You can save a copy of your visual with your own changes from this tool.
- Workflows for Report: Click the conversation icon to show or hide the visual's workflows or conversations.
Lasso and Zoom Tools
Configurable Lasso Tools
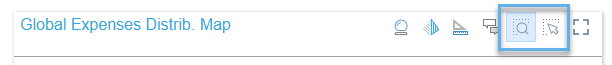
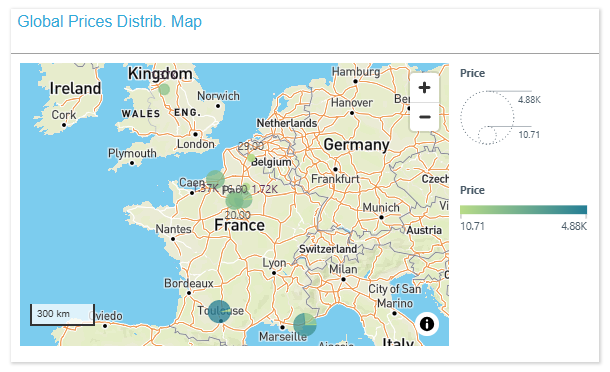
For Maps, most Charts, and Grids the lasso tools are as follows:
- Zoom Lasso: (Not available for Scatter Plots, Segment Charts, or Grids.) Draw a shape on your canvas to grab multiple items at once, zoom in on those items, and perform your configured Action (typically, this is Select).
- Select Lasso: Draw a shape on your canvas to grab multiple items at once and then perform your configured Action.
Set Configuration
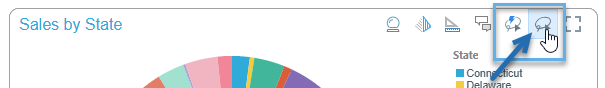
Unlike the other panel tools, both of the Zoom Tools allow you to select configurations before you use them. The configuration panel is opened by right-clicking the panel tool button (orange arrow below) and selecting Actions and Shapes that you want to use from the menu therein:
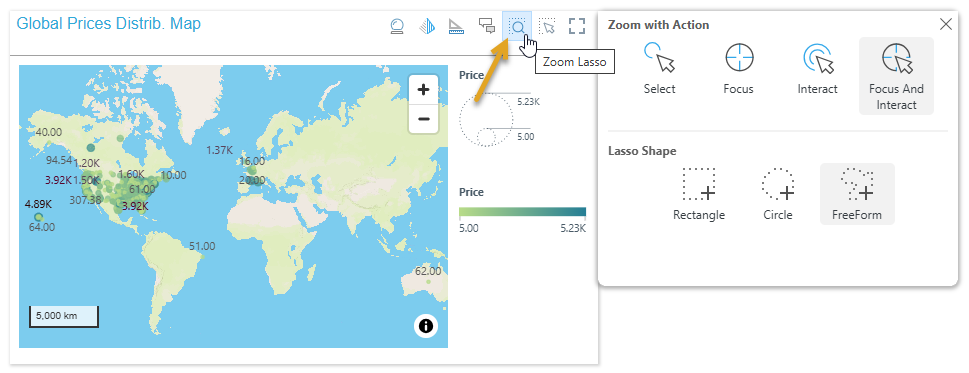
Actions
When you grab contiguous items using one of the lassos, you can perform one of the following Lasso Actions on them all:
- Select: Select the items inside your lassoed area. Once selected, you can access actions that are applicable to your selections on the right-click context menu.
- Focus: Filter the data points to keep those that are inside your selected area. This makes your view less "noisy."
- Interact: Interact as soon as the selection is made; for example, cross-filter the target visuals without clicking Interaction on the context menu.
- Classify: Classify your selected data points as being "in" a group and any other data points (those that are not selected) as being "out" of that same group.
- Focus and Interact: Filter the data points to keep those that are inside your selected area and run the Interact action right away.
Shapes
When you select contiguous items using one of the lassos, you can choose to use one of the following Lasso Shapes:
- Rectangle: When you drag your lasso across the items, you draw a rectangle shape. Everything inside the rectangle is selected.
- Circle: When you drag your lasso across the items, you draw a circle starting at its center and moving outwards. Everything inside the circle is selected.
- FreeForm: Draw a shape "free hand" that selects your data points. You do not need to draw a "closed loop," you simply click and, holding your mouse button, draw the shape or line. Your action finishes when you release your mouse button. Anything that the line intersects and any area that would be filled if you joined your first and last points, as indicated by the shaded area, is selected.
Example: Drawing a FreeForm Lasso
As an example of Lasso Configuration, you can use the panel shown above to select FreeForm to indicate that you want to draw a shape "free hand" on the canvas and Focus and Interact to indicate that you want to focus on the data points inside your shape and run the Interact action.
With the Zoom Lasso selected, you can now draw your shape:
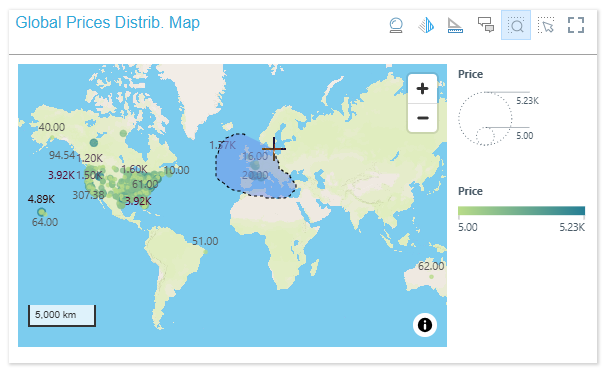
Tip: Unlike some drawing tools, you do not need to draw a "closed loop" using your FreeForm lasso. You simply click and, holding your mouse button, draw the shape or line, finishing your action when you release your mouse button. Anything that the line intersects, and any area that would be filled if you joined your first and last points (as indicated by the shaded area), is selected.
Once you "drop," you clear the data points outside of the lassoed area, run the Interact action (updating other cross-referenced visuals, for example), and also (because we are using the Zoom Lasso) zoom in on your selected area:
Lasso Tools
For gauge charts, where the lasso configuration options are not available:
- Auto Lasso Selection: use the dynamic lasso selection tool if cross-visual interactions have been configured. Click the dynamic lasso tool then drag your cursor to select the required data points. The target visuals will be filtered by the selected data points.
- Lasso Selection: use this to select multiple data points, and then interact with them.
Full Screen
You can use the Full Screen panel tool to make your visual fill the screen (use up all of the available space).