The drop zones work together with the metadata trees and the visualization engine to run your query and produce a visualization. Queries are built by adding the required metadata from the trees to the appropriate drop zones.
Once an item is added to a drop zone what is referred to as a 'chip' is generated in the selected zone. This chip represents the chosen metadata, and is color-coded according to its metadata type: measure and values chips are orange, while hierarchy chips are blue. Each chip can be dragged to a different zone, right-clicked to open its context menu, or removed from the query as required.
How the Drop Zones Drive the Query
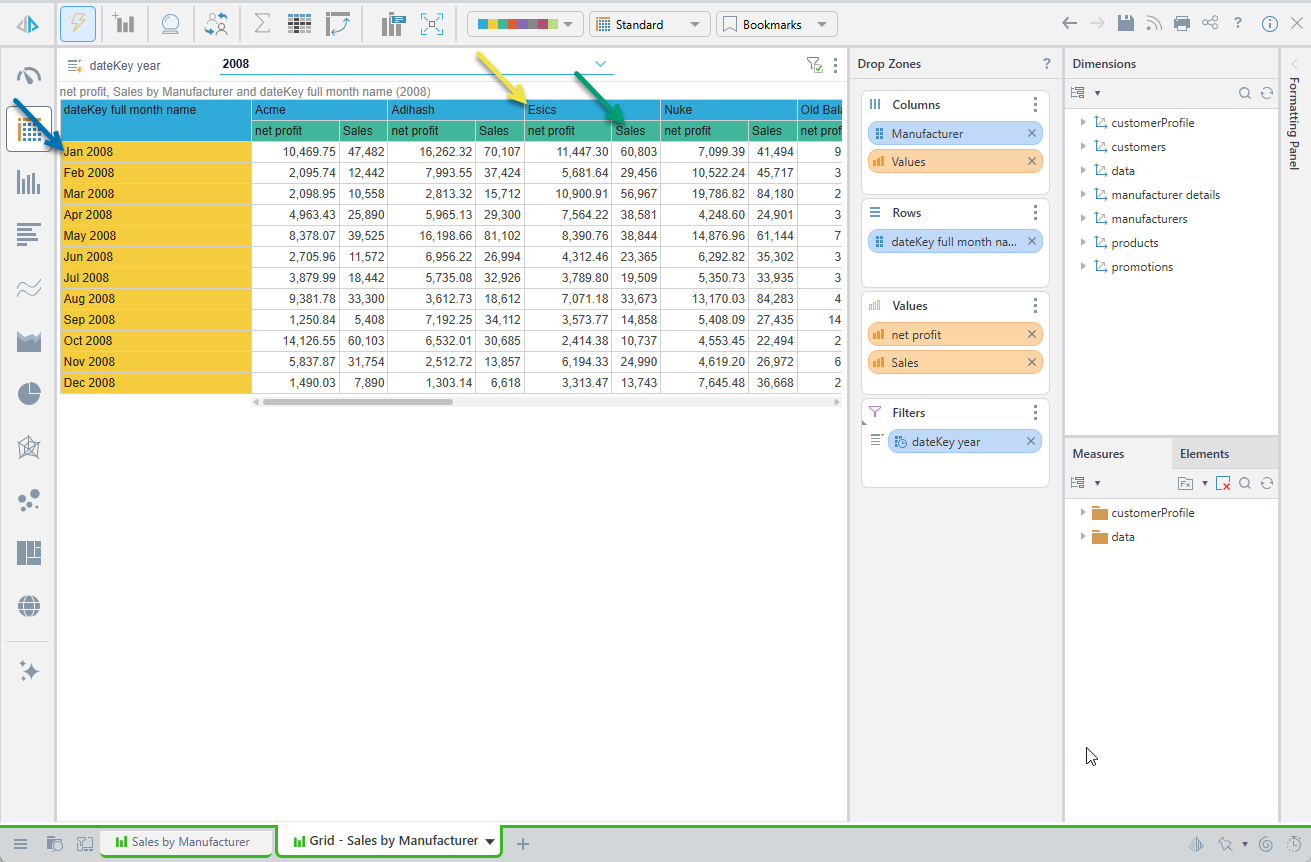
The drop zones drive the query, in that they determine which metadata will queried, and where it will be located in the visual. For example, in the image below:
- The Manufacturer hierarchy was added to the Columns drop zone; driving the columns in the grid. This means that we see that the elements from the Manufacturer hierarchy appear as grid columns (yellow arrow).
- The Values chip was also added to the columns zone, and each measure is represented as a sub-column, underneath the manufacturer (green arrow). The order in which the chips are placed within a zone is important; if the Values chip was moved above the Manufacturer chip in the columns zone, then the manufacturers would be presented as the sub columns.
- The DateKey Month chip was added to the Rows zone, meaning that the months from the hierarchy are represented as rows (blue arrow).
Note: The Filter drop zone is also used to limit the Grid to the data from the year 2008.
How the Visualization Affects the Drop Zones
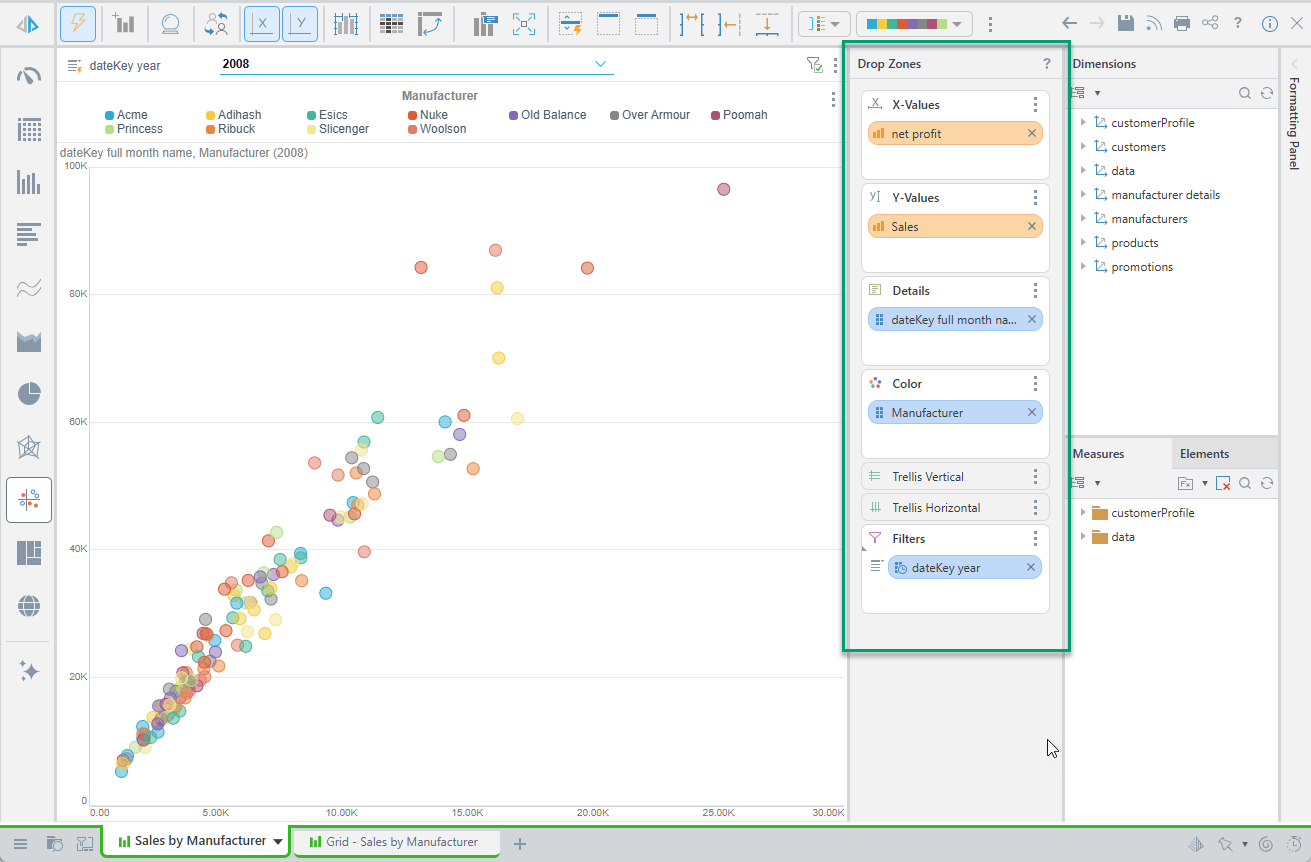
The drop zones are also affected by the chosen visualization type. Each visual requires different inputs, so the drop zones change according to the selected visual. In this example, the grid in the query above was changed to a Scatter Chart. The drop zones were automatically updated accordingly, presenting the zones associated with the scatter chart (green highlight below).
Note: Pyramid automatically rearranges the chips into the appropriate drop zones to produce the chart.
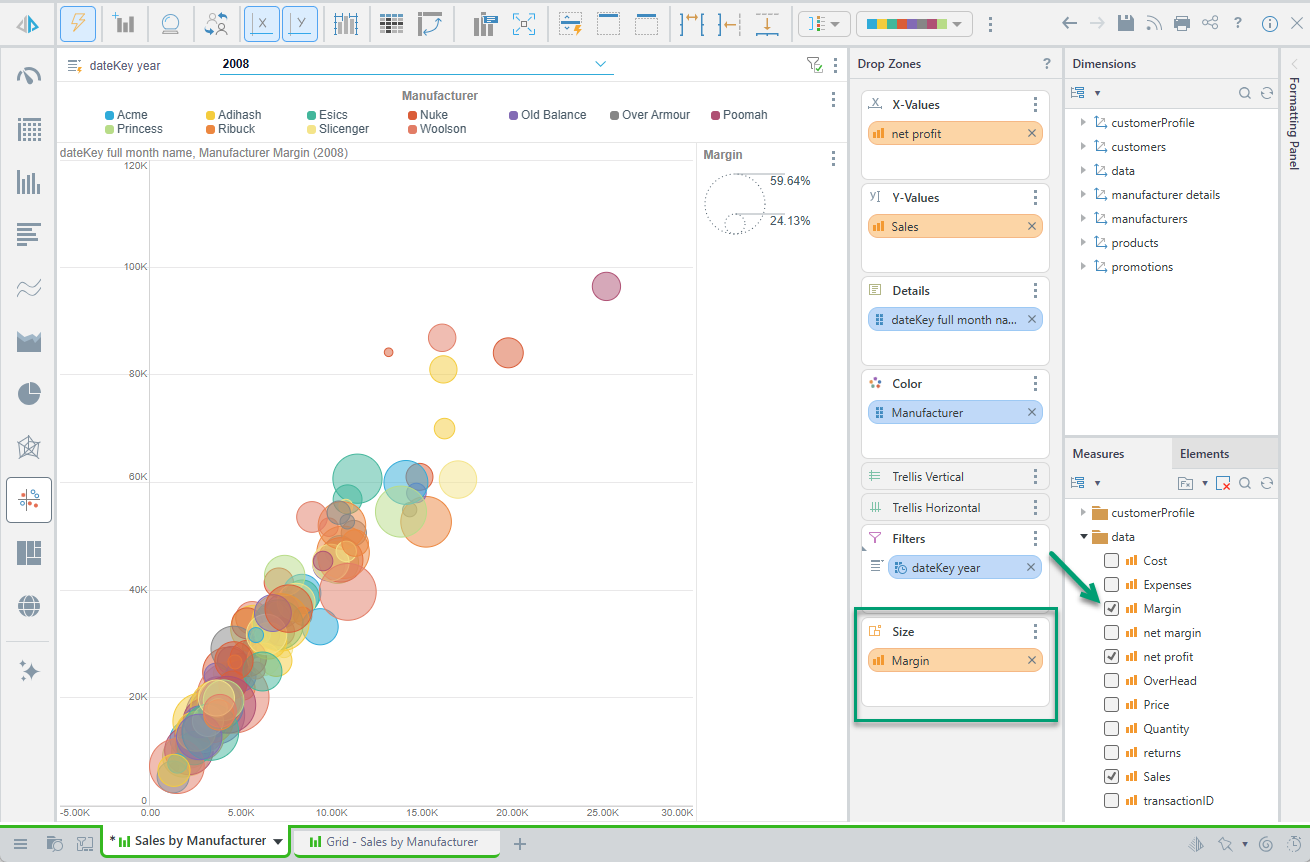
Next, a third measure was double-clicked or selected in the Measures tree (green arrow below); this action automatically generated the Size zone, and added the new measure to it. This new measure is now driving the size of each of point in the scatter chart. We can see how the metadata trees, drop zones, and visualizations complement each other, and work in conjunction to create a smart and intuitive report-building experience for the user.