For users to intuitively build data visualizations, reports and queries they need access to the structures of their chosen data model (or cube). These items - often called "metadata" - are exposed in various panels throughout the application. However, they feature most prominently in Discover, where they are used to construct queries and visualizations.
The key "tree" structures are
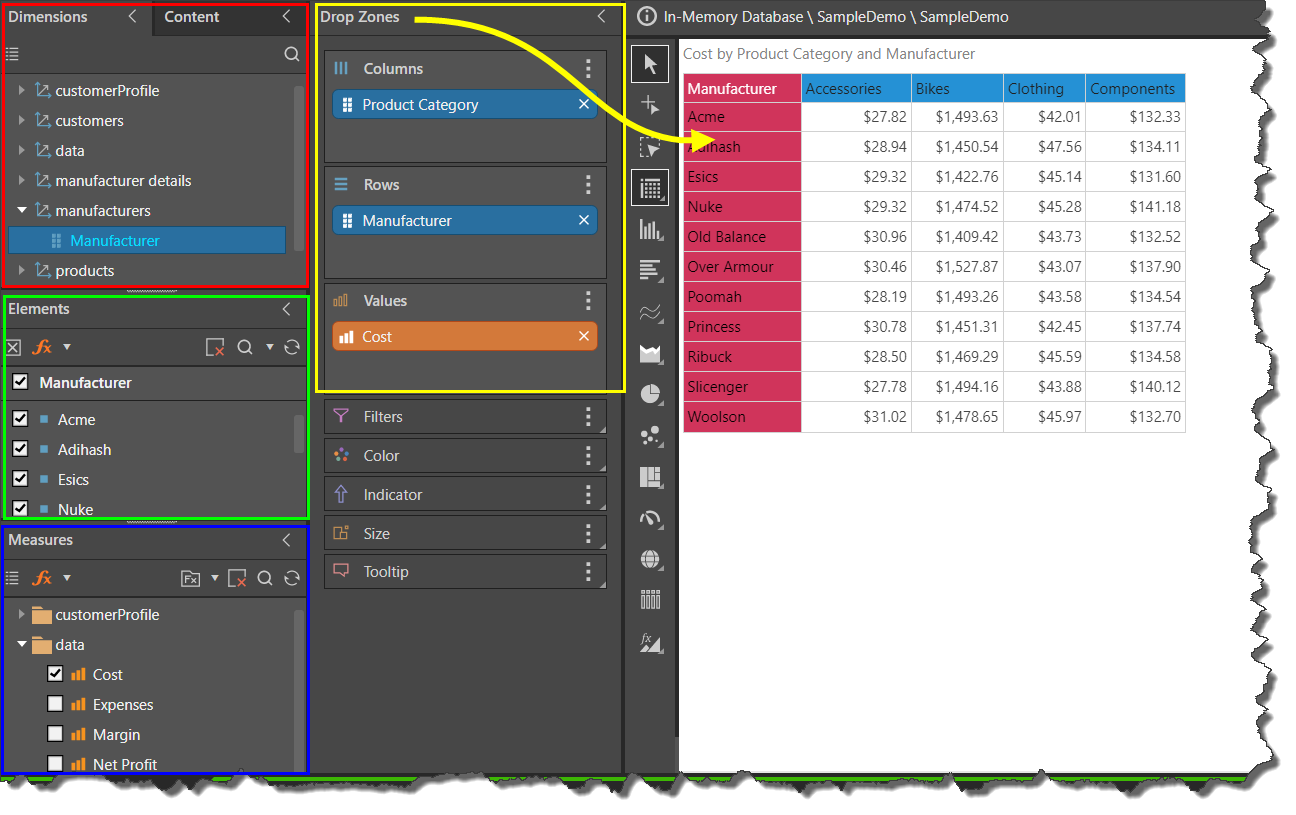
- Dimensions and Hierarchies (red highlight below) - The Dimension Tree contains the data model's dimensions, hierarchies and attributes, and hierarchy properties (for SAP BW and MS OLAP). Dimensions and Hierarchies typically correspond to the tables and columns found in the data source.
- Member Elements of Hierarchies (green highlight) - The Elements Tree exposes the individual member elements contained within hierarchies or attributes.
- Measure Values (blue highlight) - The Measure Tree exposes the data model's values or measures, which are used to populate the visualization with quantitative data.
Using Model Structures
These trees form the building blocks of query-design in Pyramid. Each tree can be traversed by the user, and items from the trees are added to the drop zones (yellow highlight) which define what data elements from the model will be queried which in turn builds the required data visualizations.
Refreshing Metadata and Localization
Data models are often changed and some come in multiple languages. The following topics cover how to refresh the meta structure elements of a data model inside a Discover session and how to change the language used to drive the different items as they appear in the tools.
- Metadata Refresh: Used to refresh the data model's metadata (hierarchies, measures and elements).
- Languages: When working with MS OLAP, Tabular, SAP HANA, and SAP BW models, the language may be changed for the trees; trees that support the given language will be translated.