Discover reports are visualizations created in the Discover module. Viewers can open discoveries that have been built by other users and shared with them. Depending on your permissions, you may also be able to create and save your own discoveries via the Analyze Further tool.
You can perform dynamic interactions on these discoveries, access extended functionality, print and export, and create scheduled subscriptions.
Opening a Discover Report
Discoveries are indicated by a green column chart icon. Discoveries can be opened in the Viewer from the User Hub or the Content Manager, or from a Direct URL pasted into a browser.
Note: Your discoveries will open in the Viewer if you are a Viewer user or if you have selected Show Viewer Mode in your User Info settings. For more information, see User Info.
Discover for Viewers
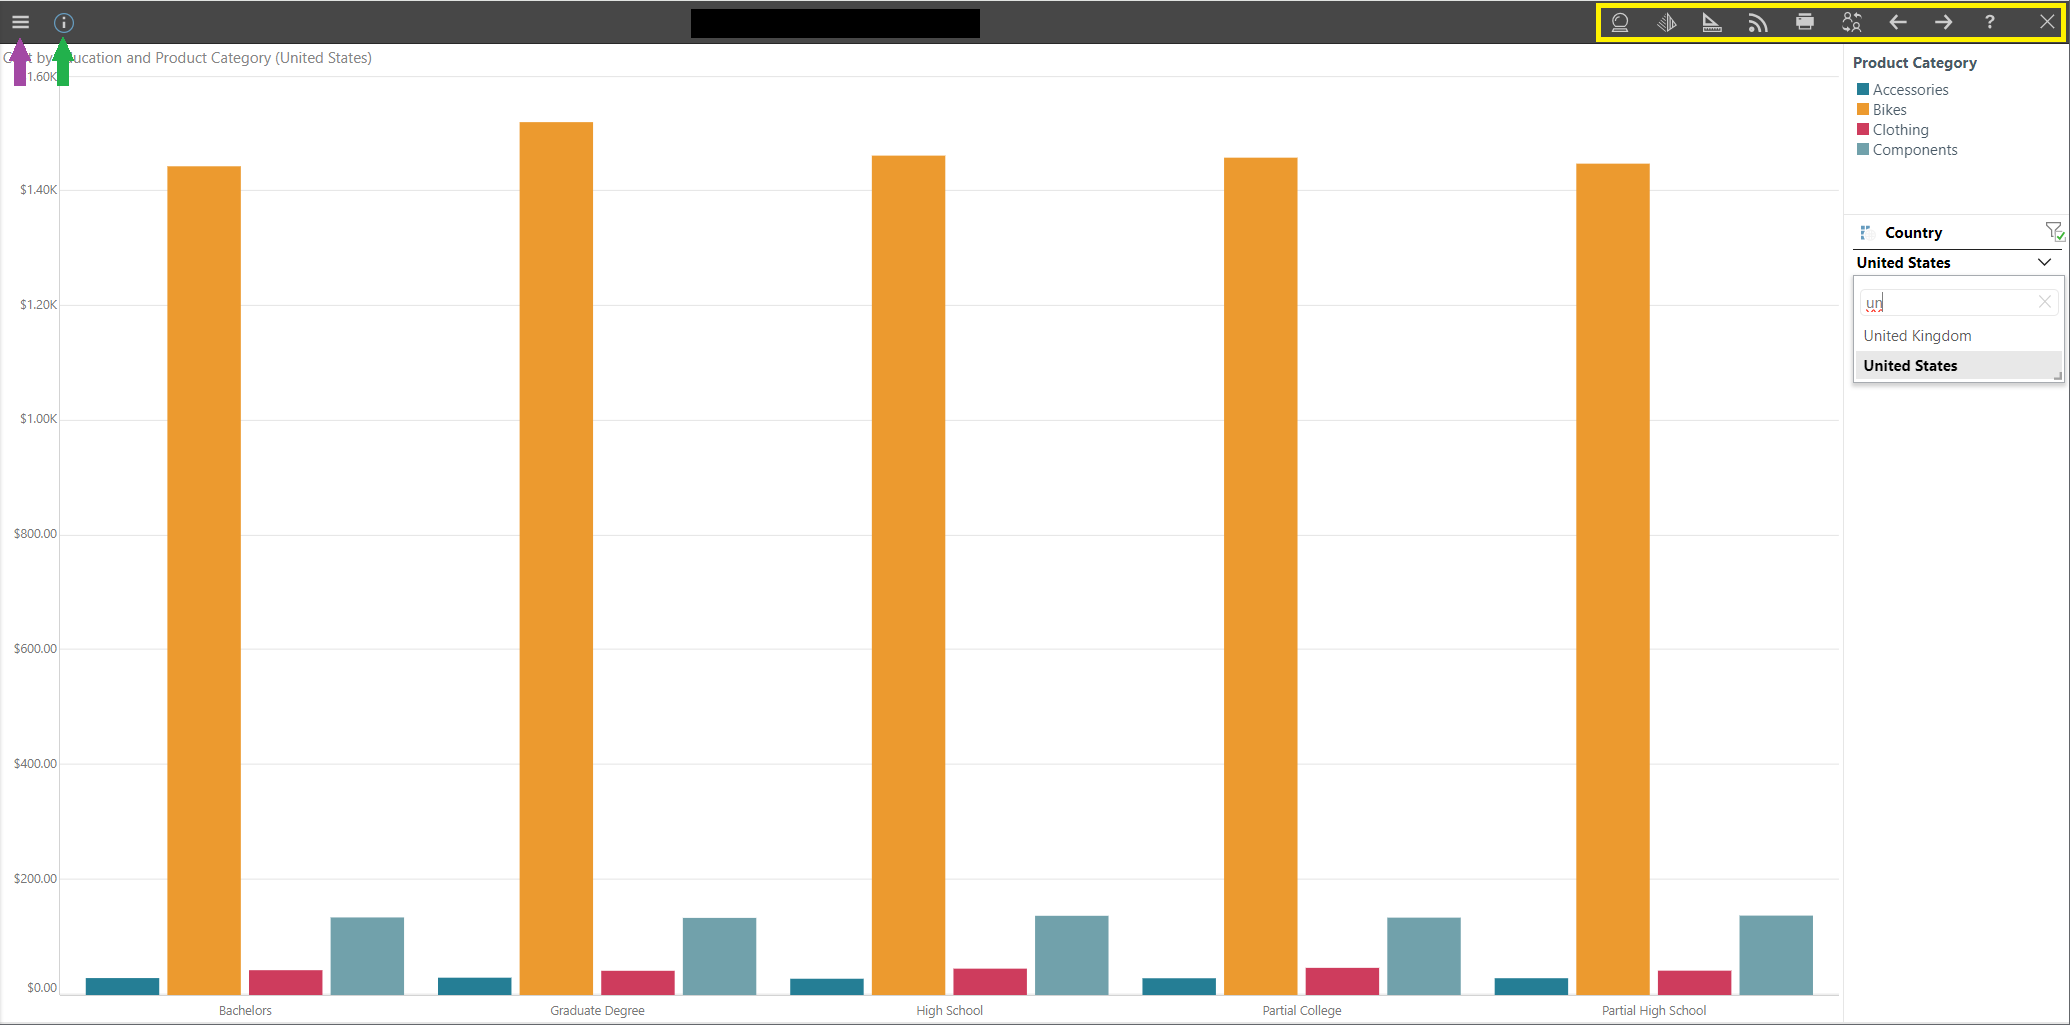
The Discovery viewer displays the visual in the middle. Along the top you can access the dashboard menu (orange highlight below), the Hamburger menu (purple arrow below), and the Metadata panel (green arrow below).
Dashboard Menu
The dashboard menu (orange highlight below) includes the following options:
- Smart Insights: Smart Insights use AI to analyze your query and return a natural language analysis. Depending on your selections, insights may represent a Summary overview of your visual or a Light, Advanced, or Categorical analysis. In Discover, you can also show visuals that illustrate the trends, forecasts, and so on that your analysis returns and explore those visuals in a pop-up.
- Chatbot: Use the Chatbot to explore your visual using natural language requests. For example, add an additional measure or exclude a region.
- Analyze Further: Open the selected discovery in Discover Lite and perform further analysis and save a new copy of the discovery.
- Subscribe*: Create a subscription schedule for the discovery.
- Share*: Opens the Share Content dialog. You can share your artifact with other users (recipients), either by attaching the exported content to an email or by sending a Share Link to the recipient for access in Pyramid. For more information, see Share Content.
- Print and Export: Print or export the discovery.
- Workflow for Dashboard: Add actionable annotations to data and reports.
Note: Subscribe and Share options are not available where the discovery is a Snapshot.
Visualization panel
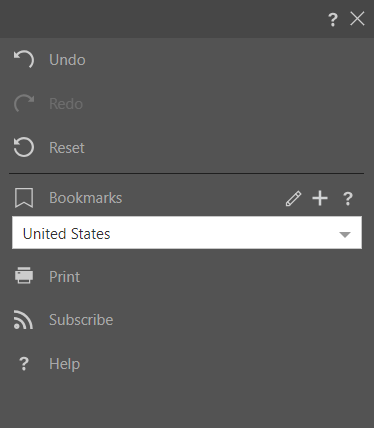
Access the visualization panel using the Hamburger menu (purple arrow, above). This panel includes the following additional options:
- Undo: Undo the previous action.
- Redo: Redo the last action.
- Reset: Reset the query to its saved state.
- Bookmarks: Add, edit, or select bookmarks.
Note: Print, Share, and Subscribe options are as described above.
Metadata

Metadata Panel
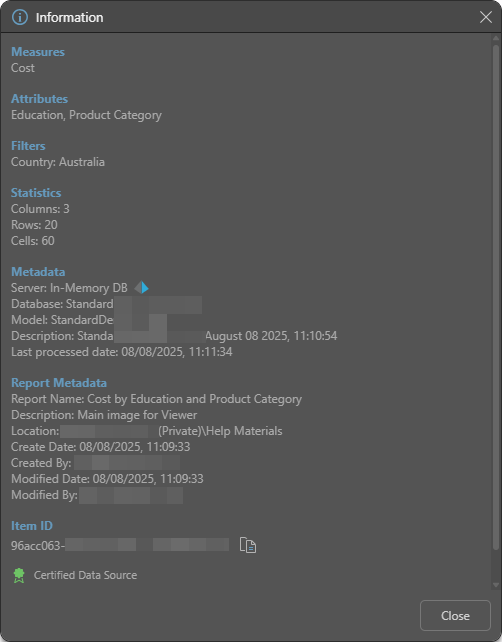
Open the Query Metadata panel to see query information, data source metadata, and report metadata. The Metadata panel details the report's metadata, including the data model being queried, the database and server it belongs to, and statistics showing the number of columns, rows, and cells in the query.
Certified Data Source
![]() The Sanctioned certificate may appear in Discover or Present. It indicates which data models have been verified and reviewed.
The Sanctioned certificate may appear in Discover or Present. It indicates which data models have been verified and reviewed.
AI-Generated Data Source
![]() The AI-Generated icon, which indicates that models might contain AI-generated data, appears alongside the model name and in the metadata when viewed at design time in Discover and Present. At runtime and in the Viewer, the same icon is used for publications and discoveries. For more information, see Identify AI-Generated Data Sources.
The AI-Generated icon, which indicates that models might contain AI-generated data, appears alongside the model name and in the metadata when viewed at design time in Discover and Present. At runtime and in the Viewer, the same icon is used for publications and discoveries. For more information, see Identify AI-Generated Data Sources.
Visual Interactions
Panels
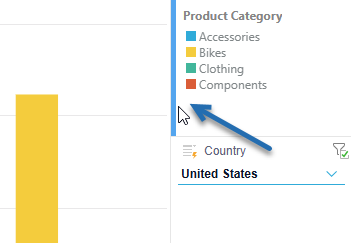
Legend, slicers, filters, and sorts appear within dedicated panels which can be moved to various locations around the canvas. Hover over the panel heading; when the cursor shows as a four-pointed arrow, drag the panel and drop it into a docking zone; docking zones display a blue highlight as you drag over them.
In the image below, the Legend is moved beside the Legend (blue arrow).
Interact with Discover Reports
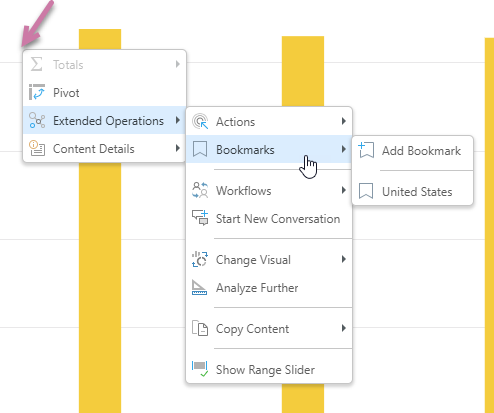
The visual context menus, available on the right-click, include a range of functions, allowing you to dynamically interact with visuals, perform further analysis on the fly, and discuss results with other users. Access the context menu by right-clicking the data point that you want to interact with.
- Click here to learn more about interacting with discoveries.