 StandardDeviation (PQL)
Returns the mathematical Standard Deviation calculation across a list of numbers.
- Returned Output: Numeric
- Library: PQL \ Common \ Statistical
- Version: 2018.00.000
- Compatibility:
- It can be combined with other PQL functions throughout the application.
- It CANNOT be used with MDX or VBA functions. But it can be used on MDX-based content in other parts of the application.
Syntax
StandardDeviation( <Numeric List> )
or
StandardDeviation( <Numeric N> )
* Click on the function's arguments above for more details on the input values.
Comments
- The list of numbers can be typed in as a comma delimited list or inserted via an array.
- If the method is used in other parts of the application, the input parameters can be changed
- In Model, the inputs can be column names - which means to find Standard Deviation values for those columns row by row
- In Formulate, the inputs can be Data points, other functions or members
- In the dynamic querying tools (like triggers, infographics and dynamic text), the inputs can be static values or other methods
Different Function types
- This function is like the Excel STDEV function - calculating a Standard Deviation across a list of items.
- If you wish to find the Standard Deviation for the elements in a specified SET or LIST from a hierarchy, use this semantic function.
- Squaring the standard deviation result will return the statistical variance for the list of numbers.
Examples
This example simply averages the values 3 to 7 (returning 1.414)
StandardDeviation(3,4,5,6,7)
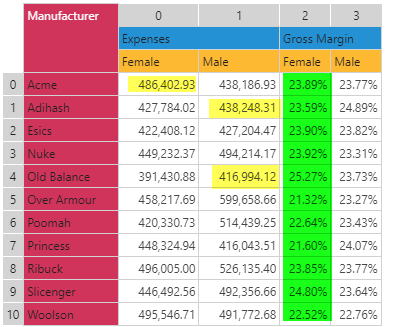
This example, using the same grid above, would return the standard deviation on all the values in column 2 (numbering is zero-based). The DataSetColumn function returns an array (list) of values from column 3 in the grid above.
StandardDeviation(dataSetColumn(2))
So it would average all items 23.89%, 23.59% etc all the way through to 22.52% (1.18%)