 ForecastPercent (PQL)
Returns the percentage change between the last actual and forecasted values for the specified periods using 'best fit'
- Returned Output: Numeric
- Library: PQL \ Dynamic \ Grid
- Version: 2020.02.000
- Compatibility: Any content (regardless of data source) in the relevant parts of the application
Syntax
ForecastPercent( <Numeric List> , <Forecast Periods> )
* Click on the function's arguments above for more details on the input values.
Comments
- The numeric listing is the set of 'existing' values that will drive the forecast formula.
- The forecast periods is the number of periods to forecast into the future,
- Forecasting uses the internal 'best fit' engine that appraises several forecasting algorithms and chooses the one with the highest statistical fit.
Examples
The example below uses the following example grid.
Note that the yellow forecasted results are shown to demonstrate the outcomes.
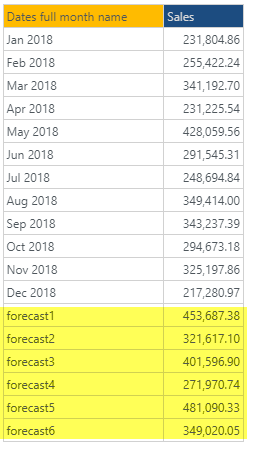
This example returns 60.63% - which is the percentage growth of the forecasted value for the 6th future period based on the 2018 data compared to the December 2018 value of 217280.97
ForecastPercent(dataSetColumn(0), 6)