In addition to the common formatting and design functions, plotted charts also support the following design options from two tabs in the Formatting panel.
Scatter Chart Formatting
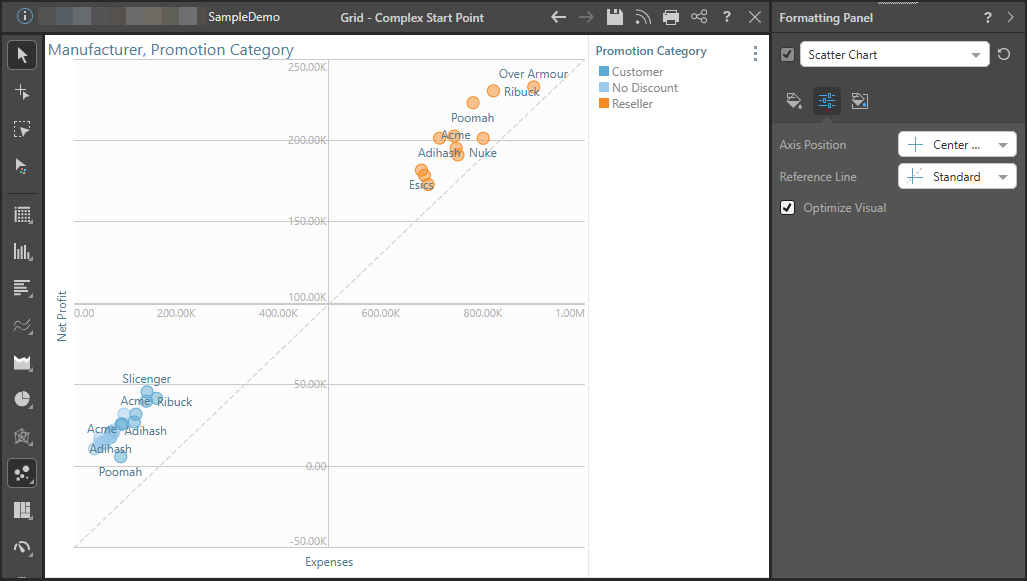
The following plotted chart (scatter plot) has been configured to show a Standard Reference Line and Center Axis Position:
Fill
- Background Color: Change the color of the Report Background using the Color Picker tool. This change does not affect the chart background.
Settings
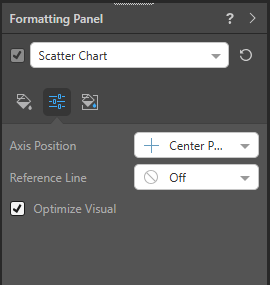
- Axis Position: Set the physical position of the x- and y-axes when working with plotted charts.
- Reference Line: Draw a reference line over the plotted chart
- Optimize Visual: The visual optimization engine in Pyramid is a heuristic that automatically redacts certain parts of a graphical visualization based on the amount of space provided.
Miniature
![]() Miniature Color 1, 2, and 3 set the text colors for miniature visuals, which appear automatically when a visual is scaled down due to legibility limits. These miniatures show measure values and labels for quick reading in limited space. Use the Color Picker to set the color for each miniature tile.
Miniature Color 1, 2, and 3 set the text colors for miniature visuals, which appear automatically when a visual is scaled down due to legibility limits. These miniatures show measure values and labels for quick reading in limited space. Use the Color Picker to set the color for each miniature tile.
Miniature visuals are created automatically when you scale a visual down to a size that makes its content illegible. These tiles typically display the measure as a number with its name underneath:
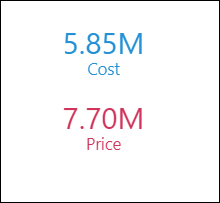
Note: The purpose of a miniature visual is to provide a way to easily view and interpret important data at a glance, even where there is a lot of information and limited space.