Add existing analytic content (Discover visuals or Tabulate visual areas) to your presentation from the content management system or by dragging in open items from the App Tabs. These content items were typically created by you or your colleagues using Discover or Tabulate and saved to a shared location; reusing them in this presentation ensures that you are always including the latest underlying analytic data from your team.
As an alternative, you might want to create and add brand new "one-off" visuals that only exist within this presentation. For more information, see:
- Creating Visuals using Discover Lite (Present Lite).
- Creating Visuals using Smart Reporting in Present Lite.
Note: You must have sufficient rights to access the visuals in the content management system to be able to see them in the Content Manager and add them to your presentation.
Adding existing visuals
Before you begin
If you want to add visuals from content management system, you or your colleagues need to have already created and saved them in advance of this task. The saved visuals must be available in the content tree in locations that you have access to, and may include existing:
- Visuals, created in Discover.
- Visual areas, defined in a Tabulate spreadsheet. Note: You cannot add a whole spreadsheet to your presentation.
You also need to have created the presentation that you want to add your visual to. For details, see Building a New Presentation in Present Lite.
Select a slide
Select the slide to add your visual to:
- From the Slides panel, click the Slide snapshot.
Tip: You can also add a new slide by clicking the Plus (+) icon at the top-right of the Slides panel.
The slide opens on the canvas in the middle of the page.
Add your visual
Add a visual from the Toolbox
- From the left-hand Toolbox, click Content (blue highlight, below).
- Locate your visual or visual area:
- If you know part or all of its name, type that value into the Search field (red arrow).
- If you want to find it in the content management structure, navigate to it through the folder tree structure (red highlight).
By default, the search tries to match your string with the beginning of your search term, so if you enter "sch" it searches for results with names starting with "sch". However, if you type "*sch" (prefixing with an asterisk) it searches for results whose name contains "sch" anywhere.
The folder tree includes your Favorites and Recent files, your personal files (My Content), files informally shared by you and other users that share your role (Workgroup Content), and any available Public Content. For more information about this structure, see Content Folder Structures.
- From the Results panel, select the visual you want to add to your presentation (yellow highlight).
- Save your changes from the Status Bar or App Tabs.
The Folders panel opens.
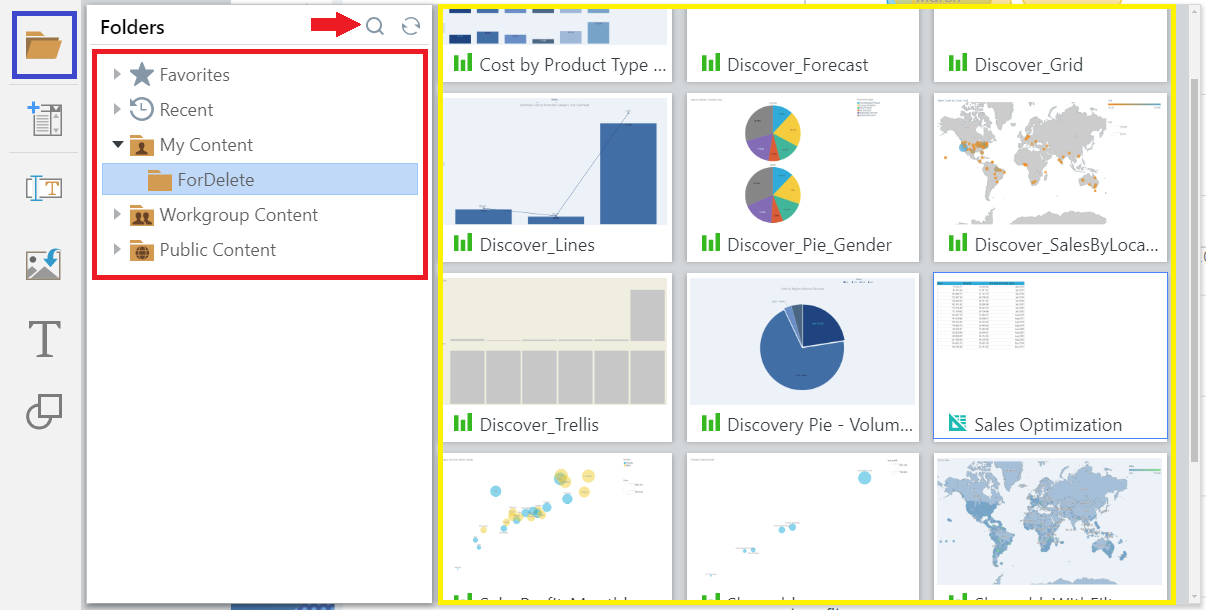
If the result contains further selectable items, you may need to make two selections. For example, if a Tabulate spreadsheet contains visual areas, you will select the spreadsheet first and then the visual area.
For more information about saving presentations, see Saving and sharing presentations

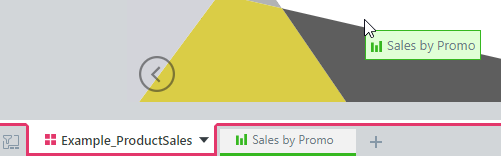
Add an open visual from the App tabs
Note: You can only add a visual to your presentation following these steps if the visual has been saved to the content management system already.
From the App tabs along the bottom of your page:
- Click the tab that represents the visual you want to add, and drag it onto the presentation:
What next?
Once you have added your visual, you might want to:
- Resize your visual: Select the panel and drag its handles to fit the space.
- Rename your visual: Right-click the panel, select Rename Title, and supply a new title.
You might also want to add additional content items to the canvas, including additional visuals, text, shapes, images, and so on.