When a hierarchy or measure is added to the Color or Shape drop zone, a corresponding legend is automatically added to the canvas. Not only can you change the formatting of these legends, but you can also edit the formatting for each of the legend's individual elements or values.
Legend Types
There are two different types of legend:
- Discrete legends: Display a discrete list of elements in the given hierarchy, or a list of measures.
- Continuous legends: Display a range of values for the given measure.
Discrete Legends
A discrete legend is made up of a list of elements or measures, which are color-coded according to the color assigned to them in the visualization. Whenever a hierarchy or list of elements is added to the color or shape zone, a discrete legend is produced.
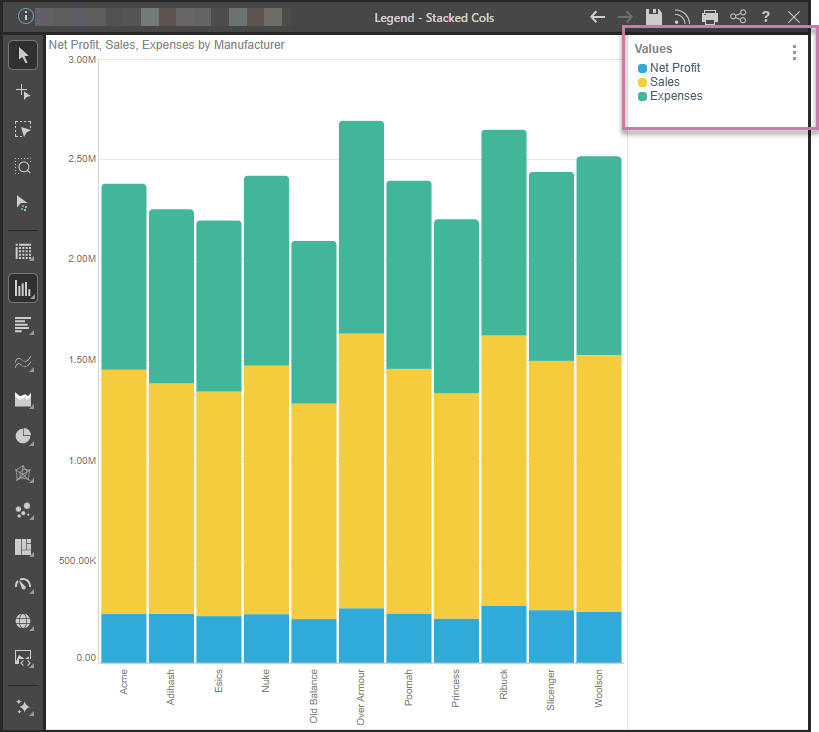
Basic Legends
Where the legend is describing the discrete colors used by columns or bars, it represents each as a marker (purple highlight below):
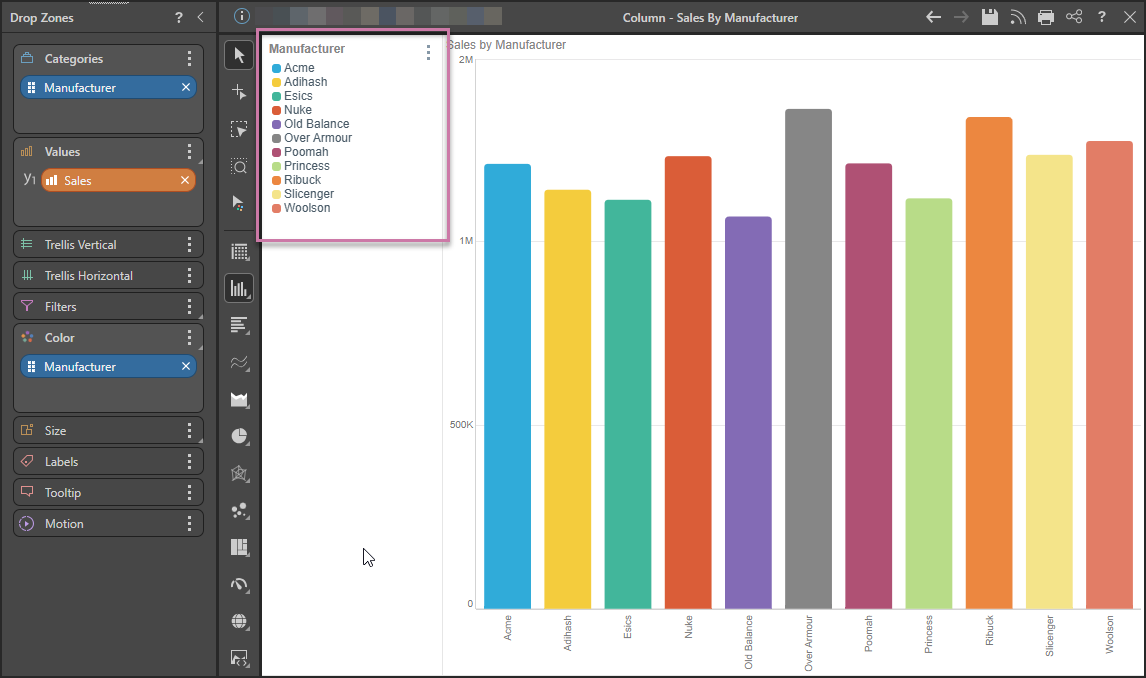
Important: When you apply a fill color or pattern to the Shapes in your chart, the change appears both on the shape and, where applicable, in the legend. For example, a dotted pink column in a column chart will have a matching dotted pink legend marker. You can set the fill color and pattern for shapes by selecting Color in the Formatting panel.
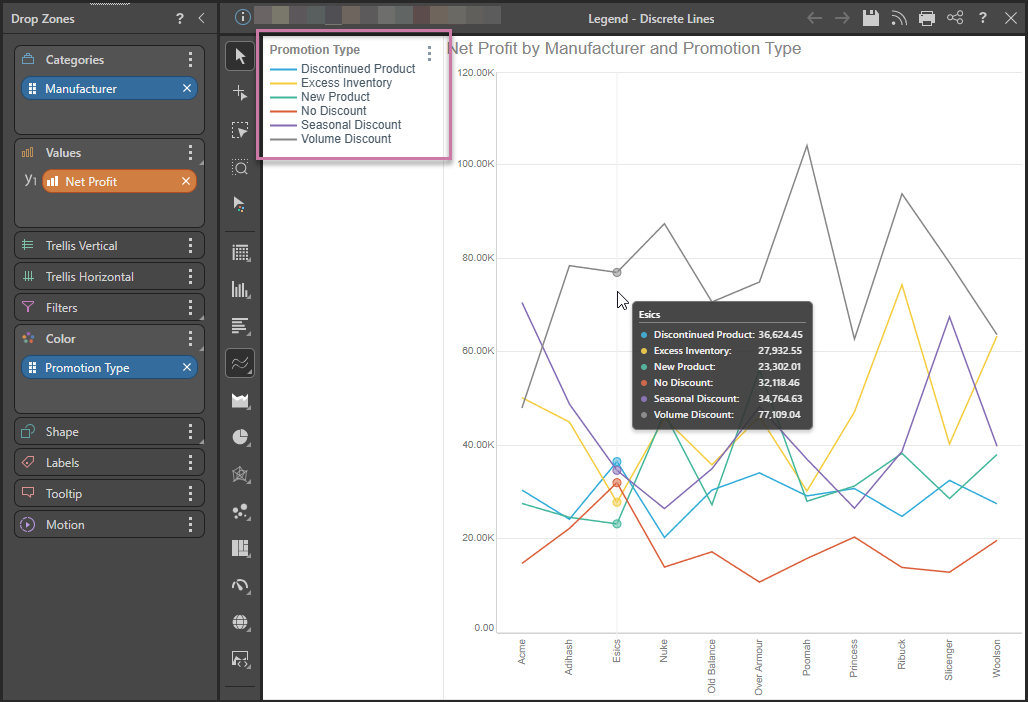
Line Legends
Where the legend is shown for a Line, Area, or Radar chart, the discrete legend uses lines in place of the standard markers, reflecting the appearance of the visual:
Lines with Shapes
If your Line Chart represents data points using Shapes, the discrete legend represents the shape on the line (purple highlight below). In this case, the Promotion Type hierarchy occupies both the Shape and the Color drop zone (green highlight), creating a combined color and shape legend:
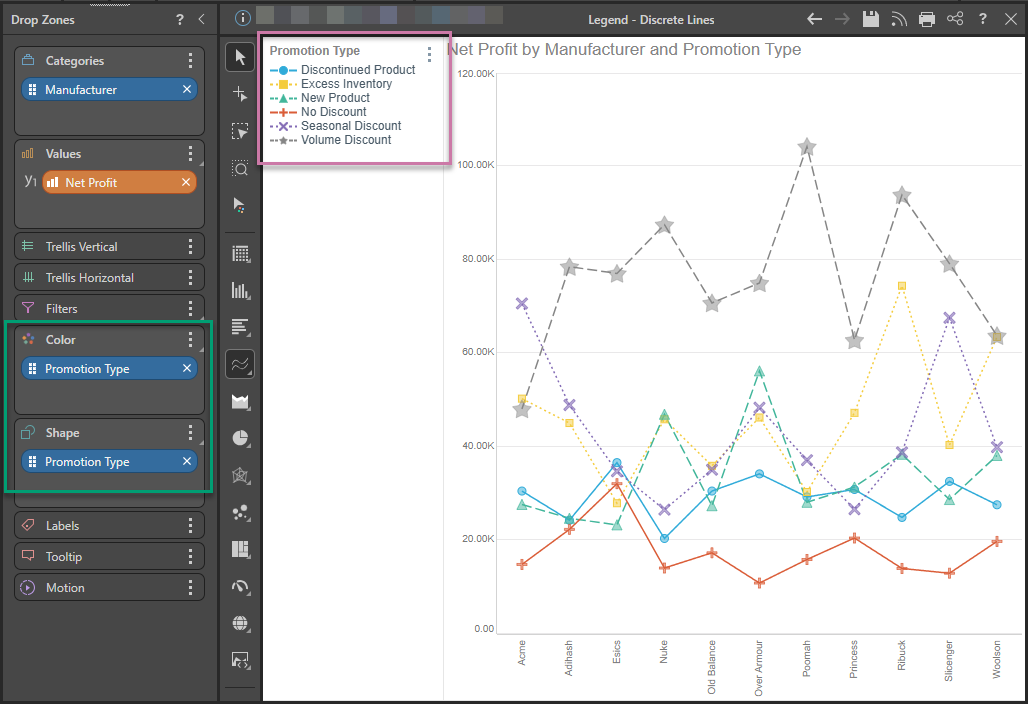
Note: Because the Shape option is enabled in the Formatting Panel, shapes are shown on the lines without you having to hover over them. Because of the Shape and Legend configuration, the shapes are also "semi-filled" (that is, they are translucent). Lastly, because of the Color configuration, the lines themselves, in the visual and the legend, are dotted or dashed.
Multi-Measure Charts
Discrete legends are also produced when building multi-measure charts, like combo charts, stacked measure charts, and multi-measure pie or doughnut charts. Each item in the discrete legend corresponds to a measure in the visual.
Each item in the discrete legend corresponds to an element or measure in the visual.
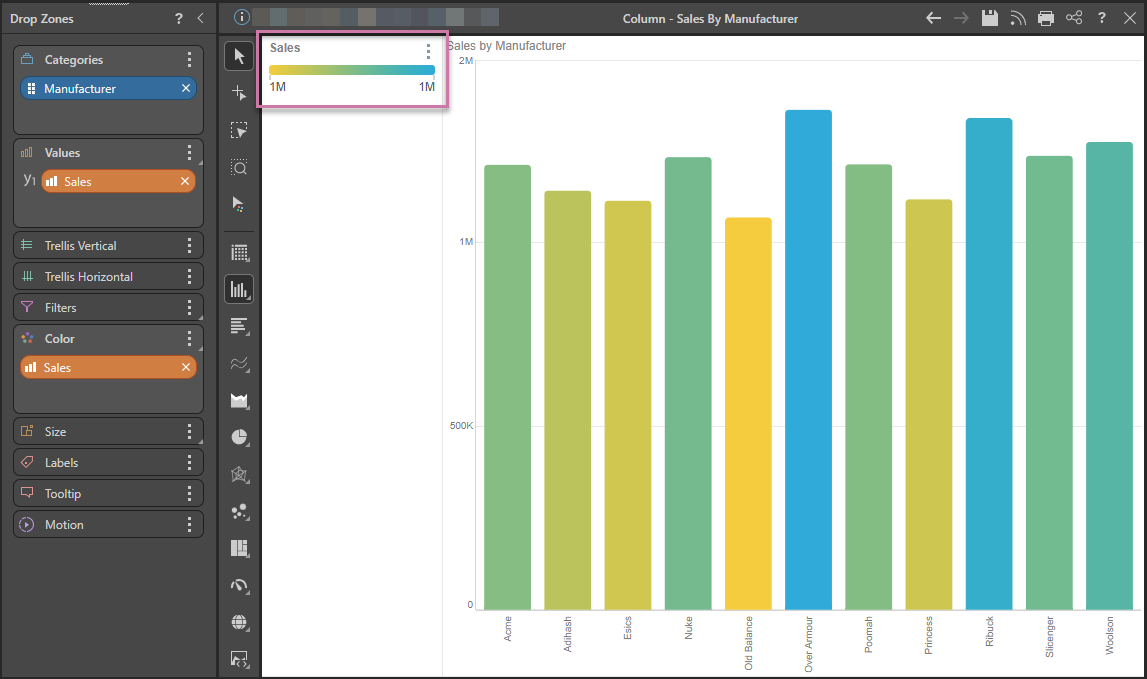
Continuous Legend
A continuous legend is one that appears as a continuous line, or box, with a color gradient reflecting the range of values for the given measure within the context of the query. Whenever a measure is placed in the Color zone, a continuous legend (purple highlight) is produced: