Click the Auto Recommend option in the Toolbox to prompt Pyramid to automatically select the most appropriate visualization type for your discovery given the current data. Otherwise, use the right-click submenu options or Change Visual options to select an alternative visualization type from suggestions that also match the data footprint. In both cases, Pyramid makes use of its AI-driven Smart Visualization engine to analyze your selected data and identify appropriate visualization types.
- For more general information about the Toolbox options, see Discover Pro Toolbox.
Auto Recommend from the Toolbox
These options involve the Auto Recommend button in the Toolbox and its right-click context menu:
Note: The context menu offers appropriate visualization types given your currently selected data. This means that the options differ depending on your selected measures, hierarchies, and so on.
Auto Recommend
To allow Pyramid to decide which visualization type to use for your selected data, click Auto Recommend. Pyramid selects a visualization type for your data and applies it.
Tip: If you are unhappy with the selected visualization type, you can use the Undo option in your status bar to return to your previous visualization type. For more information, see Undo and Redo throughout the Client.
Suggested Visualization Types
To select one of the visualization types that Pyramid recommends:
- Right-click Auto Recommend.
- Select the visualization type that you would like to apply to your visual.
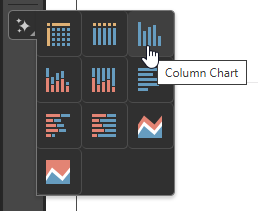
The Recommended Visualization Types submenu opens (see above). These visualization types comprise a subset of the available visualization types and have been selected by Pyramid.
The visualization type is applied.
Combo Chart
 Where the Smart Visualization engine identifies your discovery as including the appropriate elements to be represented by a Combo Chart, the Combo Chart option is made available for selection from the Auto Recommended options. Selecting this option converts your visualization into a Combo Chart, which is a combination Column and Line Chart. For more information about Combo Charts, see Combo Charts.
Tip: When you hover your cursor over the items in the submenu, a tooltip opens with the name of the visualization type. For more information, see Visualization Types.
Related information
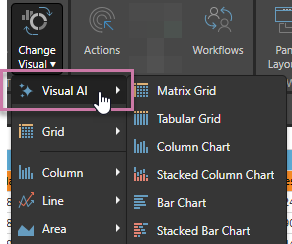
Auto Recommend from the Ribbon
You can also change your visualization type from the Change Visual menu in the Report ribbon. The Visual AI submenu offers the Auto Recommended Visualization Types as generated by the Smart Visualization engine: