 Illustrate
Use Illustrate to build dynamic data-driven images and text, which can then be added to presentations and publications.
Users can configure data interactions between images and text, and a selected content item, in order to create dynamic images and text that add additional meaning and context to a report. Once saved, they can be added to presentations and publications, just like any other content. These images and texts are rendered at runtime.
The ability to read data to drive graphics and text is limited to queries that are visualized through grids only.
- Click here to see the Illustrate Tutorials Video Library
Launching the Illustrate App
App Toolbox
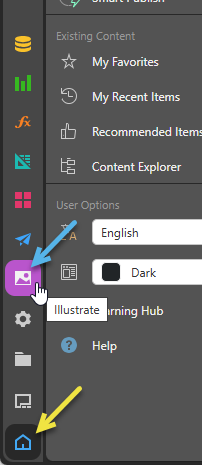
Enter the Illustrate module from the Pyramid home page by clicking the purple Illustrate icon from the left-hand toolbox.
App Tabs
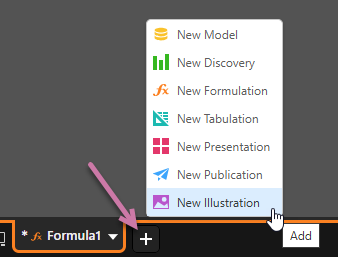
Users can also access Illustrate from within another module by clicking the plus sign along the bottom panel and selecting New Illustration from the pop-up menu.
Content Explorer
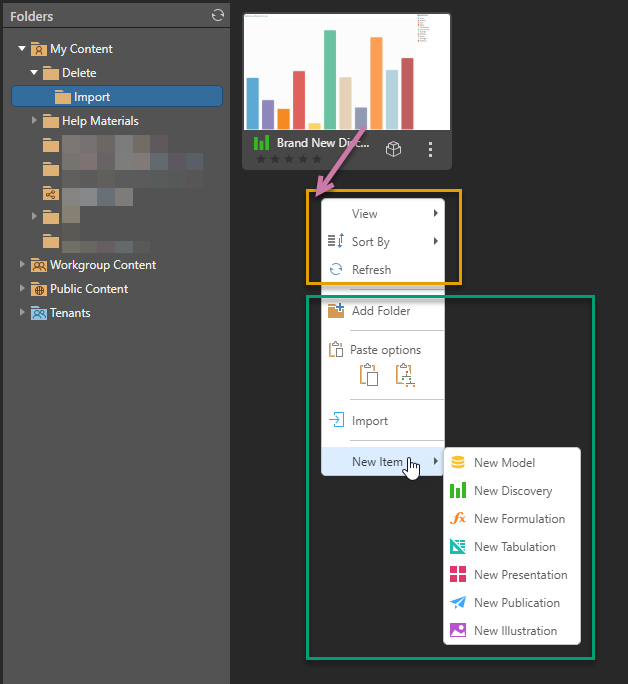
You can also create a New Illustration by right-clicking the background in the Content Explorer and choosing New Item > New Illustration from the context menu. You will then be prompted to provide a name for your new illustration:
Empty Illustration
Whichever method you use to start Illustrate, the Illustrate workspace is displayed and there is a new illustration with the name IllustrationX (where X is a number) in the view:
![]()
What next?
Now that you have created a new illustration, you should start adding content to it. The following topics should be your starting point: