Average (PQL)
Returns the mathematical average operation on a list of numbers.
- Returned Output: Numeric
- Library: PQL \ Common \ Statistical
- Version: 2018.00.000
- Compatibility:
- It can be combined with other PQL functions throughout the application.
- It CANNOT be used with MDX or VBA functions. But it can be used on MDX-based content in other parts of the application.
Syntax
or
* Click on the function's arguments above for more details on the input values.
Comments
- The list of numbers can be typed in as a comma delimited list or inserted via an array.
- If the method is used in other parts of the application, the input parameters can be changed
- In Model, the inputs can be column names - which means to average values for those columns row by row
- In Formulate, the inputs can be Data points, other functions or members
- In the dynamic querying tools (like triggers, infographics and dynamic text), the inputs can be static values or other methods
Different Function types
- This function is like the Excel AVG function - calculating a average across a list of items.
- If, instead, you wish to change the aggregate of a numeric column in the database to average, use this function
- If you wish to find the average for the elements in a specified SET or LIST from a hierarchy, use this semantic function.
- The alternative approach to the sum function divided by the count function.
Examples
This example simply averages the 4 values 3 to 6 (4.5)
average(3,4,5,6)
This example averages 3 data points inside the dynamic calculation engine. Each data points is read from the underlying query.
average(data(0,0),data(1,1),data(4,1))
So, using the grid below, this would return the average of 486402.93, 438248.31 and 416994.12.
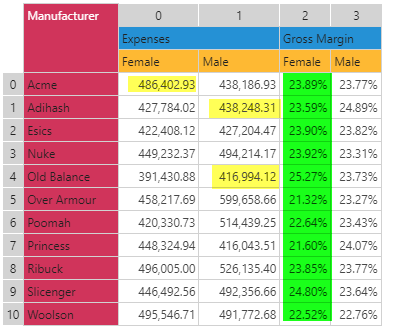
This example, using the same grid above, would average all the values in column 2 (numbering is zero-based). The DataSetColumn function returns an array (list) of values from column 3 in the grid above.
average(dataSetColumn(2))
So it would average all items 23.89%, 23.59% etc all the way through to 22.52% (23.39%)
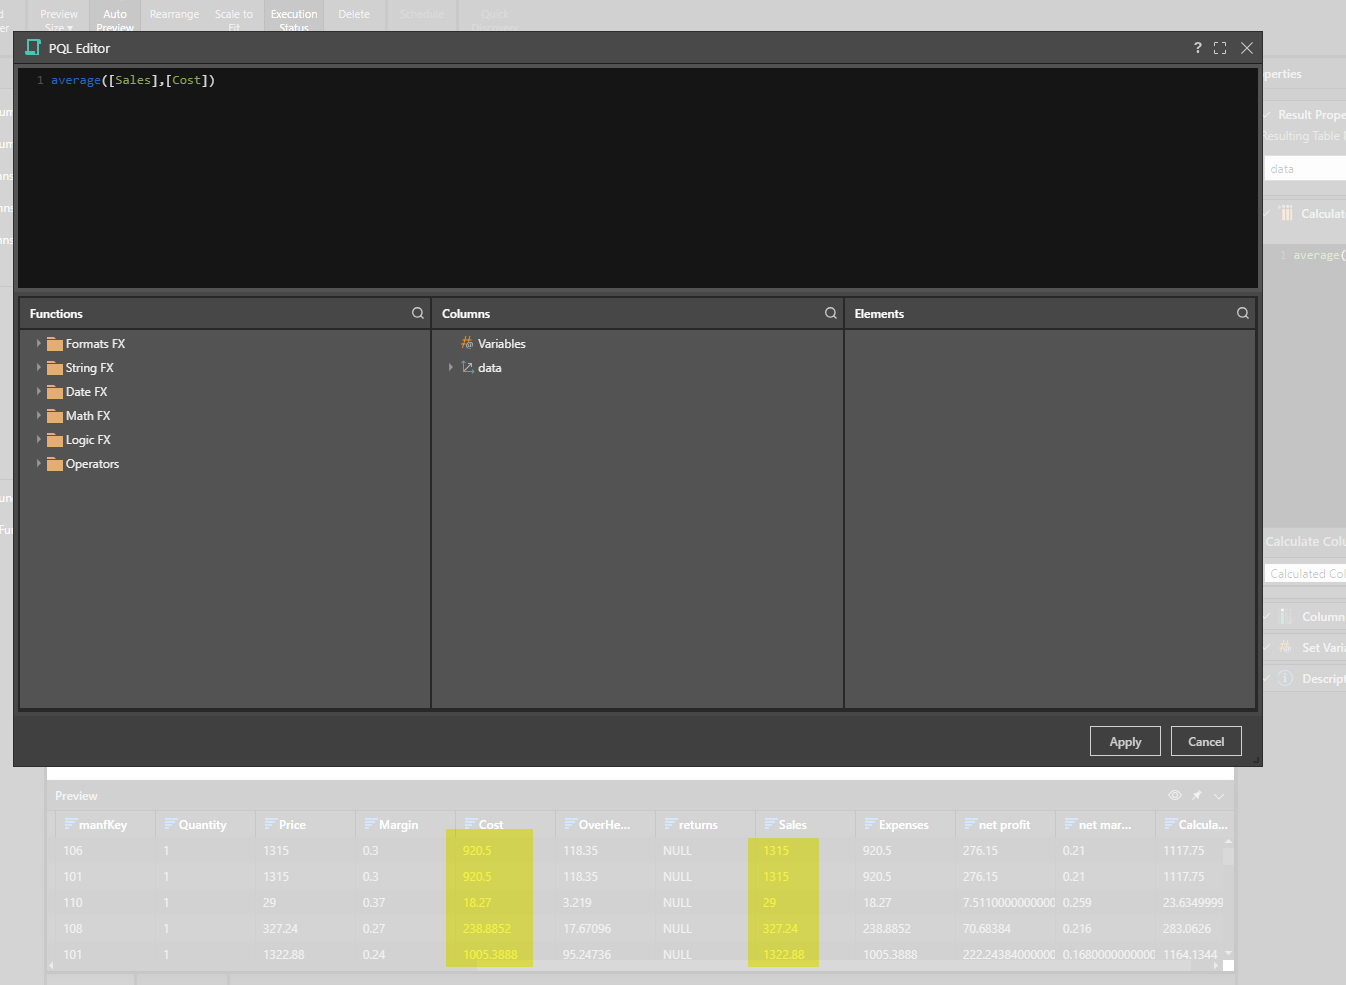
This example, used in the modeling tool (as shown below), would average the values from the sales and cost columns together. Because it is processed on a row basis, the calculation would reach a value from each column per row to find the outcome. So it would average 920.5 and 1315 (1117.75), followed by the next row with the same input values.
average ([Sales],[Cost])
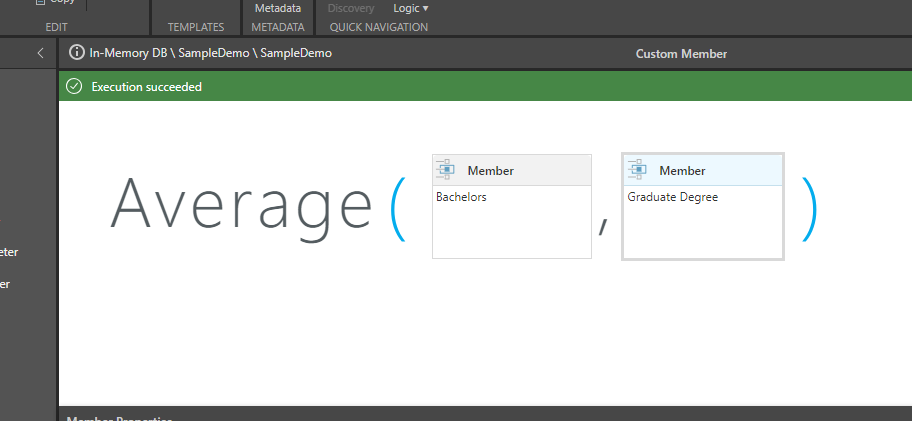
This example average two 'members' inside the Formulate tool. This formula will always provide the average of "Bachelors" and "Graduate Degree". The values behind these two elements are driven by CONTEXT - meaning they would reflect what ever measures / values where relevant to the specific data points when the calculation is applied.
average([customerProfile].[Education].[Bachelors],[customerProfile].[Education].[Graduate Degree])
Using the graphical formula builder, this example would appear as follows in the Formulate editor.