Use the data labels options to manage the appearance of "total labels" on stacked charts. Where your chart is "stacked," you can show labels for both the stacked segments and the column or bar total.
For general information about formatting your Data Labels, see Data Labels in Discover Pro.
Total Labels
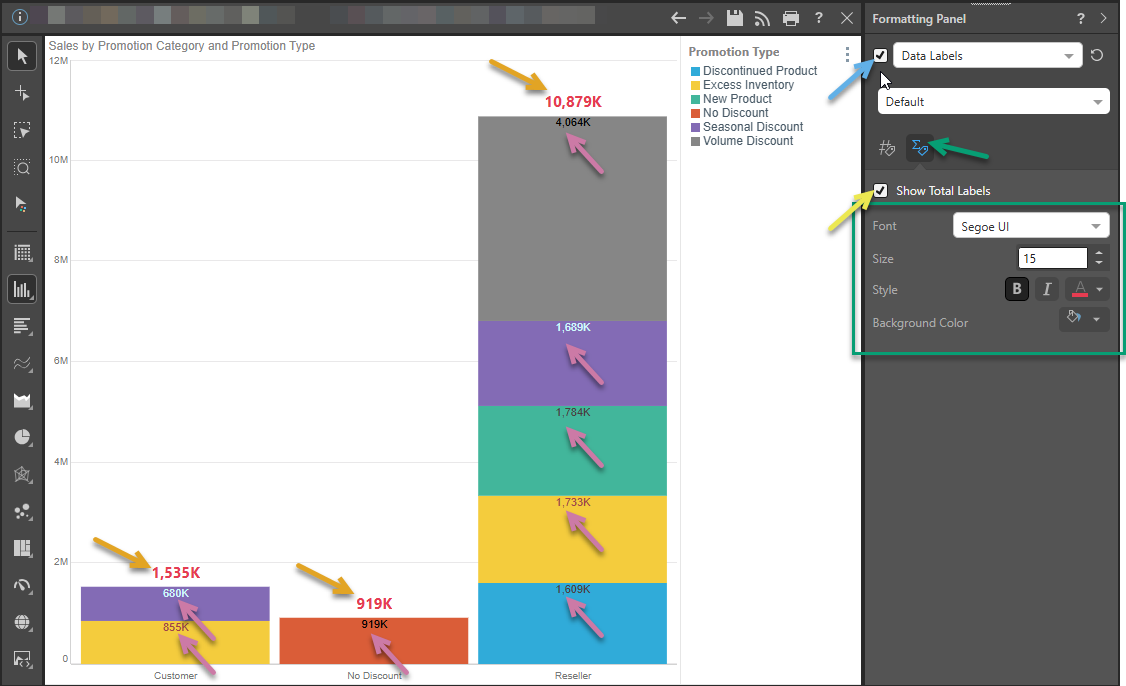
Total Labels can be added to the top of your column or end of your bar in your stacked charts. The following column chart shows both column labels and total labels. The total labels are shown in RED at the top of each column (orange arrows below):
Note: This functionality is available for: Stacked Column Charts, Stacked 100% Column Charts, Marimekko Charts, Stacked Bar Charts, and Stacked 100% Bar Charts.
Formatting your Total Labels
With Data Labels selected in the Formatting panel:
- Select the Data Labels checkbox (blue arrow below) to show the segment data labels.
- On the Total Labels tab (green arrow), select the Show Total Labels checkbox (yellow arrow) to show a single total label for each column or bar on your stacked chart.
The purple arrows indicate those segment data labels that are shown in the example stacked column chart.
The orange arrows indicate the total labels. In the example case, this is a total for each column.
Configuring Total Labels
While the segment data labels are formatted using the Label Font fields described in the Data Labels topic, the Total fonts are independently formatted using the options on the Total Labels tab (green highlight, above).
- Font: Change the font type.
- Size: Change the font size.
- Style: Change the font style (bold, italics, or font color, which is changed using the Color Picker).
- Background Color: Change the background color using the Color Picker.