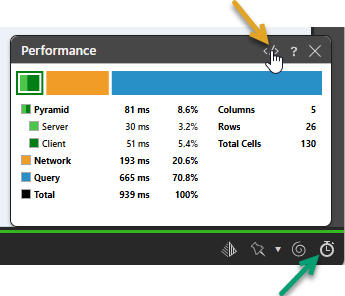
The Benchmark Performance dialog allows users to better understand the time taken in processing requests in Discover. It displays information relating to the performance of the query, including the time taken for the query to run, the processing time on Pyramid (both server and client) and the network, and its number of columns, rows, and cells.
This information enables the user to review the query performance and assess whether there may be a performance issue by comparing the query time with the query size.
Note: This tool is only available to admins, and will only appear if the benchmark logging option has been enabled in the Admin Console. Benchmark logging, if enabled, has a large impact on performance. For more information, see Log Settings in Admin Console.
Access the Performance dialog
Once the feature has been enabled and discovery is open in the view, the user will see a Clock icon in the App Tab status bar. Click the Clock icon (green arrow below) to open the Performance dialog:
Metrics
Time Metrics
- Pyramid Time: The time spent before and after submitting the query in Pyramid's own processes. The time is further split between the client and the server components.
- Network: The time spent sending and retrieving a query's result across the network (or internet).
- Query: The time taken by the data source to respond to the request and provide results.
Result Size Metrics
Pyramid retrieves results in a tabular format (even if the final visualization is shown as a cross tabulation or chart). As such, the result sizes are shown in their raw tabular form:
- Columns: The number of columns retrieved in the result set. This may be more than the visible items in the query as it includes any peripheral data points needed to draw the result.
- Rows: The number of rows retrieved in the result set.
- Total Cells: The number of cells retrieved in the result set (rows x columns).
Query Text dialog
Click the Code icon </> (orange arrow above) at the top of the Performance dialog to open the Query Text dialog. You can see the actual query (for SQL and MDX) that was submitted to the data source for processing in this dialog.
Note: If caching is enabled, you may see the message "Query Cache" in the Query Text window. To resolve this, close the window and disable the cache using Cache Options > Disable Cache on the Query ribbon. For more information, see Query Settings.