Use the Zoom Lasso to select multiple items at once and zoom in on your selection. This lasso type allows you to draw a boundary around your desired content, selecting or focusing on all items that fall within a simple rectangle, circle, or "free form" shape and zoom in on them.
This tool is typically useful for making contiguous selections. It is also useful where you are selecting a small subset of a large number of items and want to interact with just that subset for a temporary period or because you have a particular set of responsibilities.
Important: The Zoom Lasso is not available for some visualization types, including Bullets, Box and Whisker Charts, Grids, and Gauges.
Zoom Lasso
You can use this tool to pick and zoom in on multiple, typically contiguous, data points on the canvas, perform the action associated with the selector (select, focus, or classify), and, optionally, right-click selected items to access the context menus; for example, to Eliminate some cells or Focus on the members you have selected in the legend.
Enabling the Zoom Lasso
From the Toolbox:
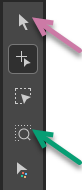
- Click Zoom Lasso (green arrow below).
Your cursor changes into a "multi-selection" tool (compass) allowing you to do one of the following:
- Drag your cursor across the data points to draw a Circle or Rectangle that selects and zooms in on the contained items.
- Draw your own shape "free-hand" on the canvas, selecting any items inside the shape and zooming in on them.
Typically, the action associated with your lasso is select. This means that the items inside your selection are selected, you are zoomed in on them, and you can make use of the right-click context menus available for your given selection.
Note: If your discovery is a Column Chart or a Bar Chart, then zooming in will add a Range Slider to your visual. You can use the Range Slider to move around at the zoomed in level or to zoom out completely. For more information, see Range Slider.
Advanced Submenu Options
If you right-click the Zoom Lasso option (green arrow below) in the Toolbox, you may be offered the following advanced submenu options. Where this is the case, you are selecting (1) the Action to take once you have selected multiple options and (2) the Lasso Shape to draw when making your selection.
These selections are applied right away and also when the lasso is next used. If you no longer want to use classify, say, you will need to change the selected options on this menu.
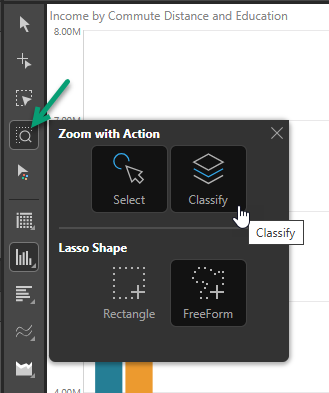
Action
The Actions describe what should happen once your selection is created. It is important to note that, for the Zoom Lasso, this action is in addition to zooming in on the selected items. For example, if you select classify and then zoom, your selection is added to a one-off custom column AND you zoom in on that selection.
Select (Default)
Select the data points or, in the case of Legends, members inside your lassoed area. Once selected, you are zoomed in to the selected location and can access actions that are applicable to your selections on the right-click context menu.
Focus
Clear all of the data points that are outside of your selected area and zoom in on the remaining data points. Focusing makes your view less "noisy." You can access actions that are applicable to the data points you have "in focus" on the right-click context menu.
To clear your focus and add all data points back onto your visual, click Undo in the Status Bar.
Classify
Classify your selected data points as being "in" a group and any other data points (those that are not selected) as being "out" of that same group. This option creates a one-off custom column in this visual, adds it into your Dimensions panel for use in your drop zones, and zooms in on it; for example, to filter your map by countries in North America and countries that are not.
Note: The Classify option is only available for Column Charts and Bar Charts on Zoom.
Tip: If you want to classify your lassoed items as a Geo Boundary on a map, you should use the Select Lasso. For more information, see Geo Boundary.
Lasso Shapes
The Lasso Shapes options describe the type of shape that you want to draw on the canvas when selecting your data points.
Rectangle
Selecting the Rectangle shape means that, when you drag your lasso across the items to select them, you draw a rectangle shape. Everything inside the rectangle is selected.
Circle
Selecting the Circle shape (not shown) means that, when you drag your lasso across the items to select them, you draw a circle starting at the circle's center and moving outwards. Everything inside the circle is selected.
Note: The Circle option is typically not available for charts that make use of rectangular forms, including Column Charts and Bar Charts.
FreeForm
Selecting FreeForm allows you to draw a shape "free hand" that selects your data points. Unlike some drawing tools, you do not need to draw a "closed loop" using your FreeForm lasso. You simply click and, holding your mouse button, draw the shape or line, finishing your action when you release your mouse button. Anything that the line intersects, and any area that would be filled if you joined your first and last points (as indicated by the shaded area), is selected.
Making your selections
You select and zoom in on data points in your visual by dragging your cursor across the various items or by drawing a FreeForm lasso shape. The selected items are highlighted as follows:
- Selected items are highlighted in full color. You also zoom in on these full color items.
- Non-selected items are "washed out." That is, they appear paler.
In the following example, two columns are selected and zoomed:
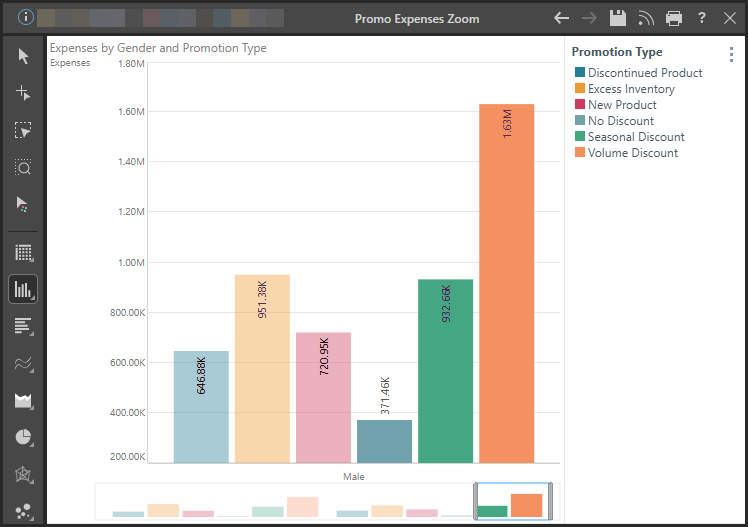
The following example shows how to use the Rectangle Shape and Select Action on the Zoom Lasso submenu to zoom in on information in a column chart.
From the Toolbox:
- Right-click the Zoom Lasso option (green arrow below) and select the following:
- Action: Select.
- Shape: Rectangle.
- Click on the diagram where you would like to start selecting your items. Hold down your mouse key and drag to draw a rectangle around those columns you'd like to include in your selection. When everything you want to focus on is selected, release your mouse key.
- Use the Range Slider at the bottom of the page to move around your zoomed chart (drag and resize the selection panel) and to zoom back out. Open the context menu by right-clicking the Range Slider itself.
You do not need to make these selections if you chose them the last time you used this lasso type. In that case, you can simply click the Zoom Lasso option in the Toolbox to enable it.
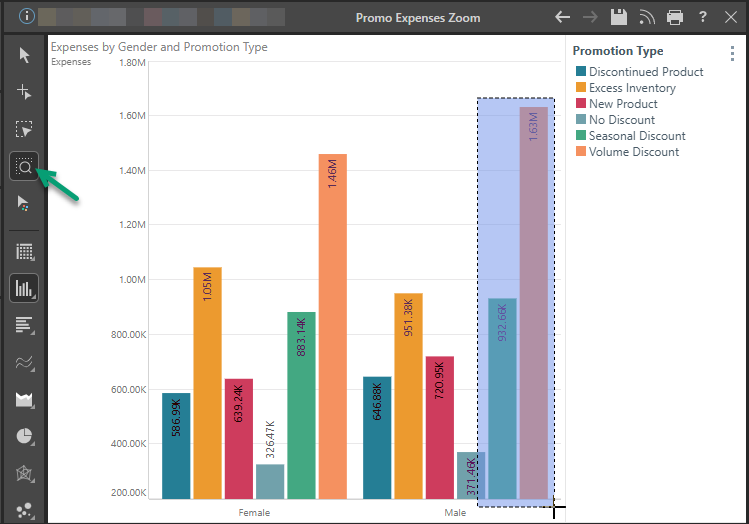
The selection that you made comes into focus:
Note: The Range Slider is placed at the bottom of the chart because this is a column chart, if this were a bar chart it would be positioned to the side.
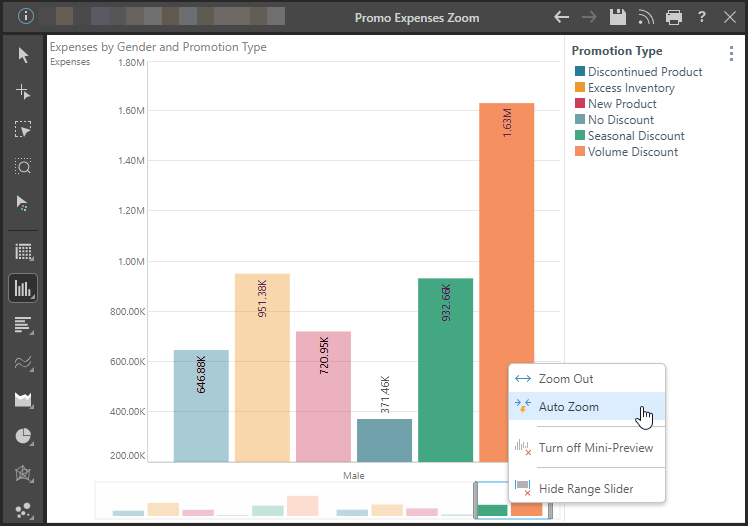
Important: If your visual is included in any presentations and you add a Range Slider by zooming, the Range Slider will be seen in the presentation by default.
Related information
Which items are present on the right-click menus when you have multiple members or data points selected depends on your selections and your discovery's visualization type. For more information, see: